
Welcome to the Forex Weekly Review for February 16–20, where we break down last week’s price action across major currency pairs and prepare a strategic trading plan for the week ahead.
Our analysis is based on:
- Market structure
- EMA89 trend confirmation
- Fibonacci retracement & extension levels
- Risk-to-Reward positioning
- Capital preservation strategy
Let’s break it down pair by pair.
EUR/USD Weekly Analysis
EUR/USD Last Week Review
If you missed last week’s EUR/USD forecast, you can revisit it here.
At the start of the week, Monday opened with a strong bullish candle, confirming the ongoing uptrend. Price successfully hit TP1 and came close to TP2 before volatility increased in later sessions.
The key support zone remains around the previous entry area (1.77x–1.81x) discussed in last week’s analysis.
Since positions are currently in profit, the priority now is capital protection. Stop Loss should be adjusted to breakeven or positive territory to lock in gains.
EUR/USD Week Ahead Forecast
D1 Timeframe – Bullish Structure Maintained
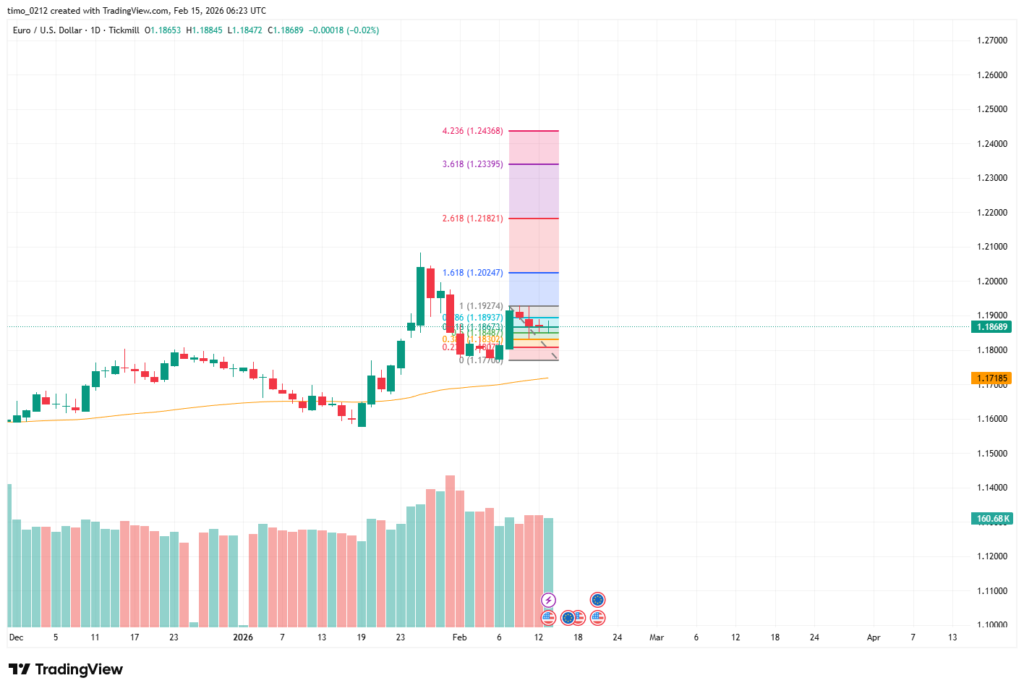
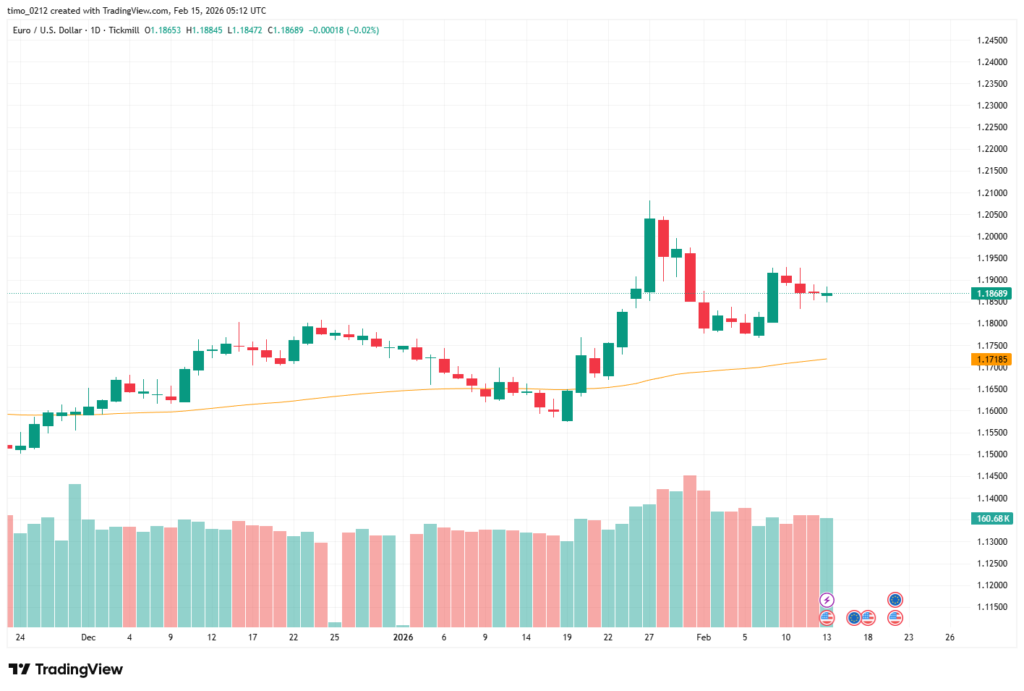
On the D1 timeframe, EUR/USD continues to trade above the EMA89 dynamic support, maintaining its broader bullish structure. The strong bullish candle at the beginning of last week confirmed upward momentum; however, the following sessions showed increased volatility.
Price corrected toward two key Fibonacci retracement levels — 0.382 and 0.5 — before finding support and rebounding. This reaction reinforces the underlying uptrend and suggests buyers are still in control as long as price remains above EMA89.
H4 Timeframe – EMA89 as Dynamic Support
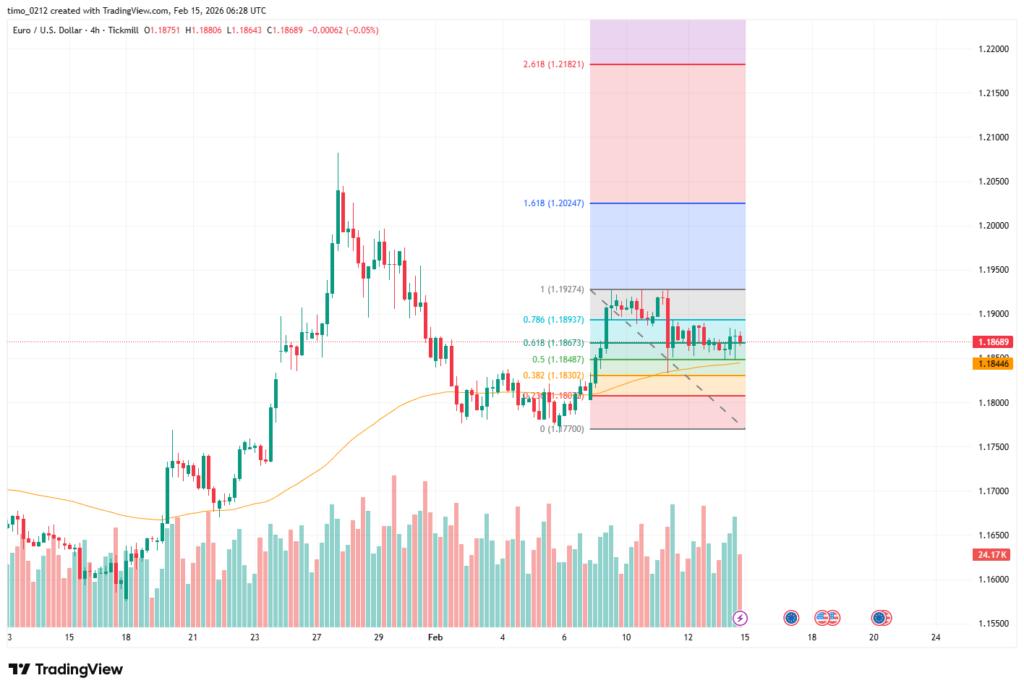
On the H4 timeframe, the strongest correction pushed EUR/USD down to the EMA89 zone before price bounced back decisively. This reaction confirms EMA89 as a key dynamic support level within the current bullish trend. As long as price continues to respect this level, the overall structure favors trend continuation to the upside.
Trading Plan for EUR/USD – Week Ahead
For traders currently holding Buy positions, consider moving Stop Loss to positive territory at 1.1827 to secure profits and reduce downside risk. The next key Take Profit levels are the recent high around 1.192xx, followed by the extended target near 1.198xx–1.20x, aligned with the Fibonacci 1.618 extension level.
For traders without an active position, potential Buy setups may be considered around the EMA89 support zone at 1.183x–1.184x, provided price shows bullish confirmation. Stop Loss and Take Profit targets should follow the same structure outlined above to maintain consistent risk management.
USD/JPY Weekly Analysis
USD/JPY Last Week Review
If you missed last week’s USD/JPY outlook, review it here.
During last week’s trading sessions, the pair opened with a bullish gap in line with the prevailing uptrend. However, it failed to sustain momentum and eventually broke below the EMA89 support, signaling a shift into a short-term bearish structure.
In the previous forecast, the projected Take Profit target offered a high risk-to-reward ratio of over 1:6, but price only reached approximately 1:4 before reversing downward. Fortunately, Stop Loss had already been adjusted to positive territory, allowing profits to be secured despite the market not reaching the full target.
USD/JPY Week Ahead Forecast
D1 – Short-Term Bearish Shift

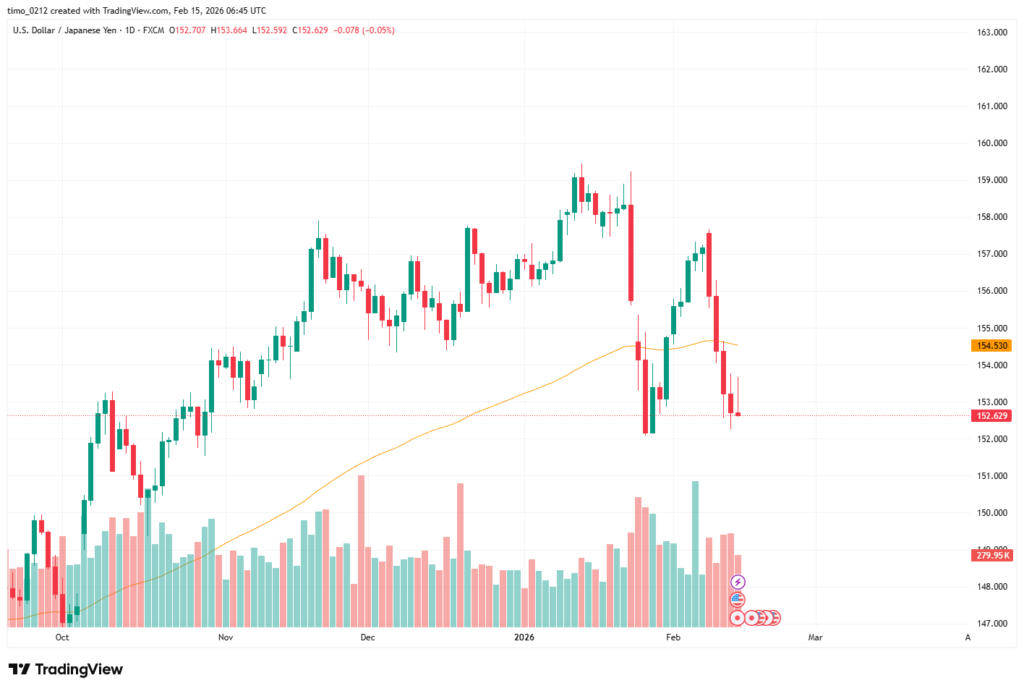
On the D1 timeframe, USD/JPY experienced a strong bearish move last week, with price breaking decisively below the EMA89 support level. This breakdown signals a shift in market structure and suggests the pair has transitioned into a short-term bearish trend. As long as price remains below EMA89, downside pressure is likely to persist.
H4 – Bearish Continuation Structure
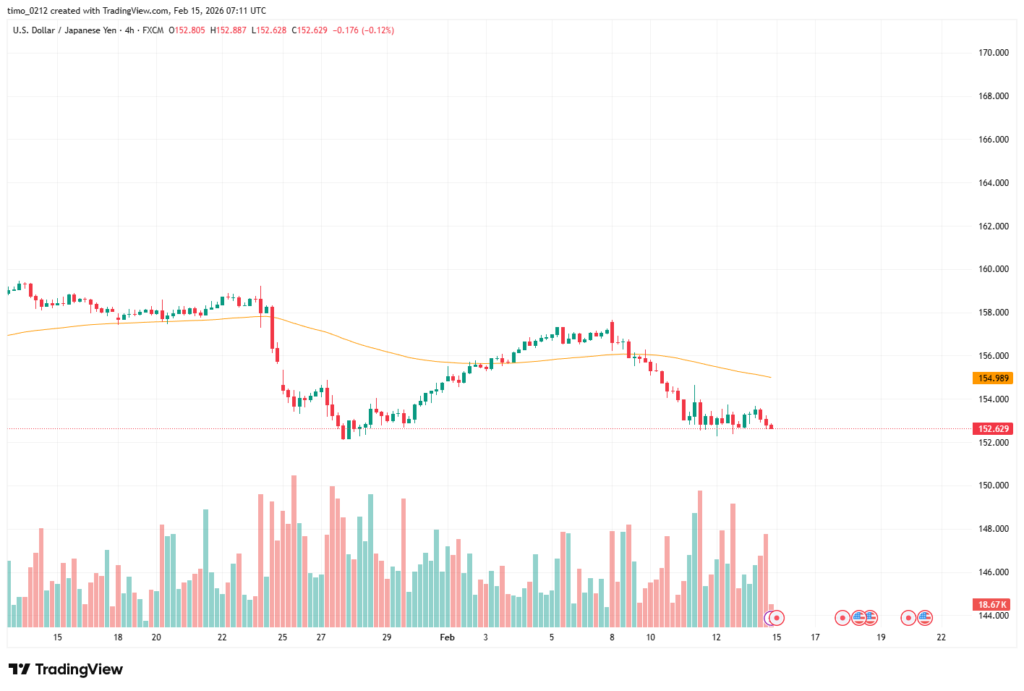
On the H4 timeframe, USD/JPY shows a similar structure to the D1 chart, confirming the short-term bearish trend after breaking below EMA89. Momentum currently favors sellers in the near term. However, a short-term corrective rebound could occur, potentially pushing price back above the EMA89 level.
If bullish confirmation appears after a strong close above this dynamic resistance, it may provide a new entry opportunity aligned with a potential trend recovery.
Trading Plan for USD/JPY – Week Ahead
For traders currently in profitable Sell positions, consider moving Stop Loss into positive territory to lock in gains and protect capital. If positions are in loss, it may be prudent to cut losses and reassess market conditions rather than hold against the prevailing structure.
For traders without an active position — or those who have already closed previous trades — it is advisable to wait for a confirmed candle close above the EMA89 level before considering new entries. A strong breakout and sustained hold above this dynamic resistance could signal a potential shift in short-term momentum.
GBP/USD Weekly Analysis
GBP/USD Last Week Review
If you didn’t catch our previous GBP/USD forecast, check it out here.
Last week was relatively volatile for GBP/USD, although the broader bullish trend remained intact. The week began with a strong bullish candle, while the following sessions showed sharp fluctuations in both directions. Despite the volatility, overall price structure continues to favor the upside. TP1 was successfully reached, and with the position currently in profit, capital preservation should now be the priority.
Consider moving Stop Loss to breakeven or into positive territory to secure gains and reduce downside risk.

GBP/USD Week Ahead Forecast
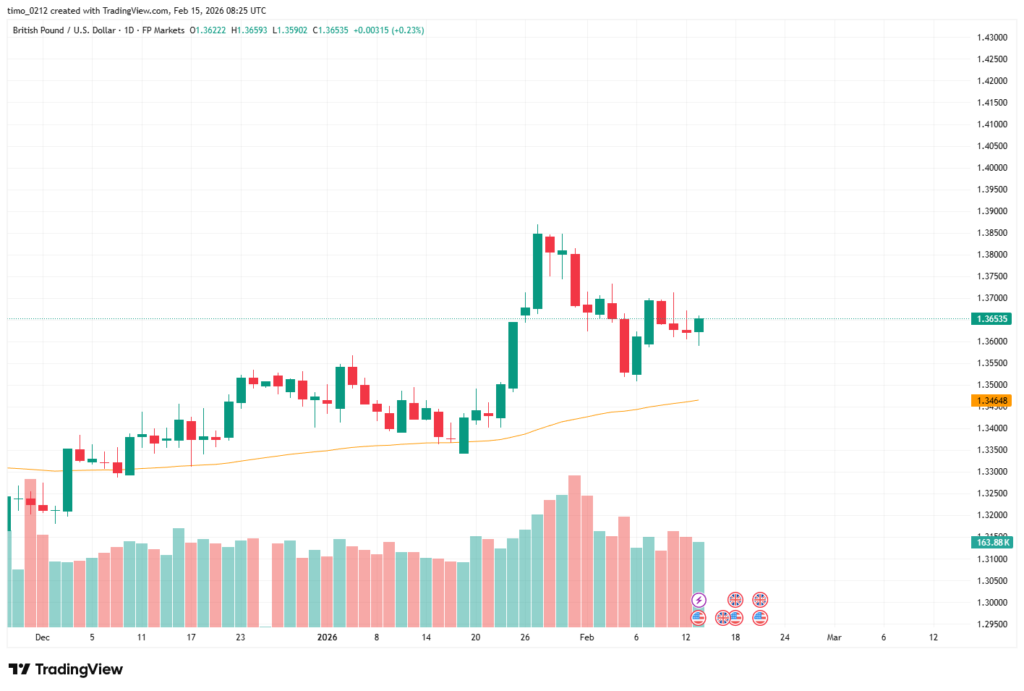
D1 – Trend Remains Bullish
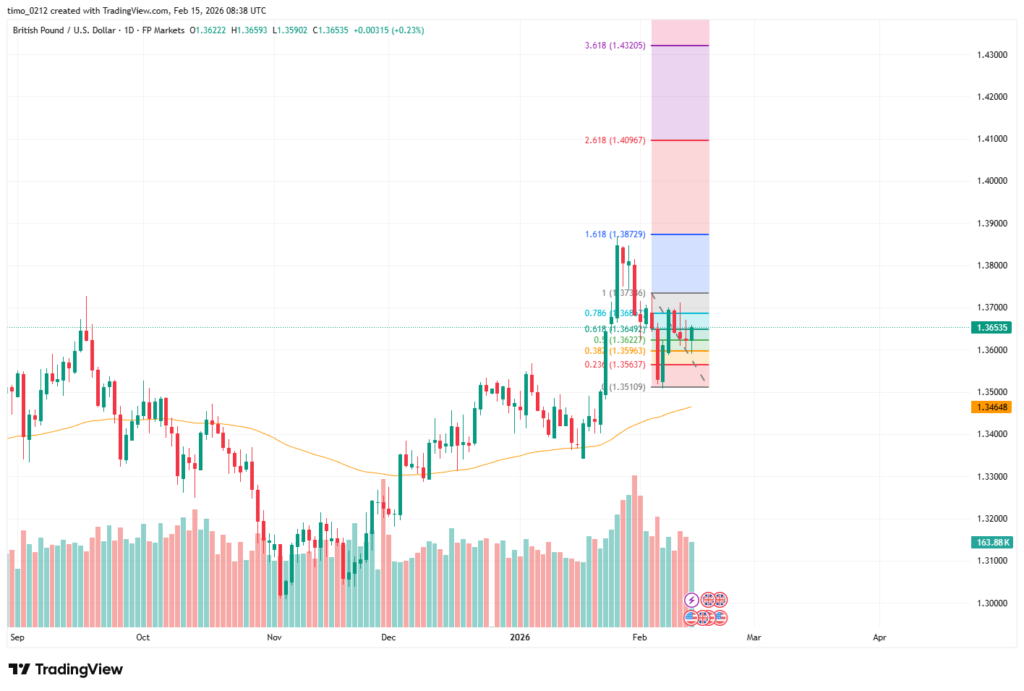
On the D1 timeframe, GBP/USD continues to trade above the EMA89 dynamic support, confirming that the broader bullish trend remains intact. After the strong bullish candle at the beginning of the week, price experienced notable volatility in the following sessions. During this correction phase, the pair retraced toward the Fibonacci 0.382 level around 1.359x, where support was observed before buyers stepped back in.
H4 – Multiple EMA89 Retests
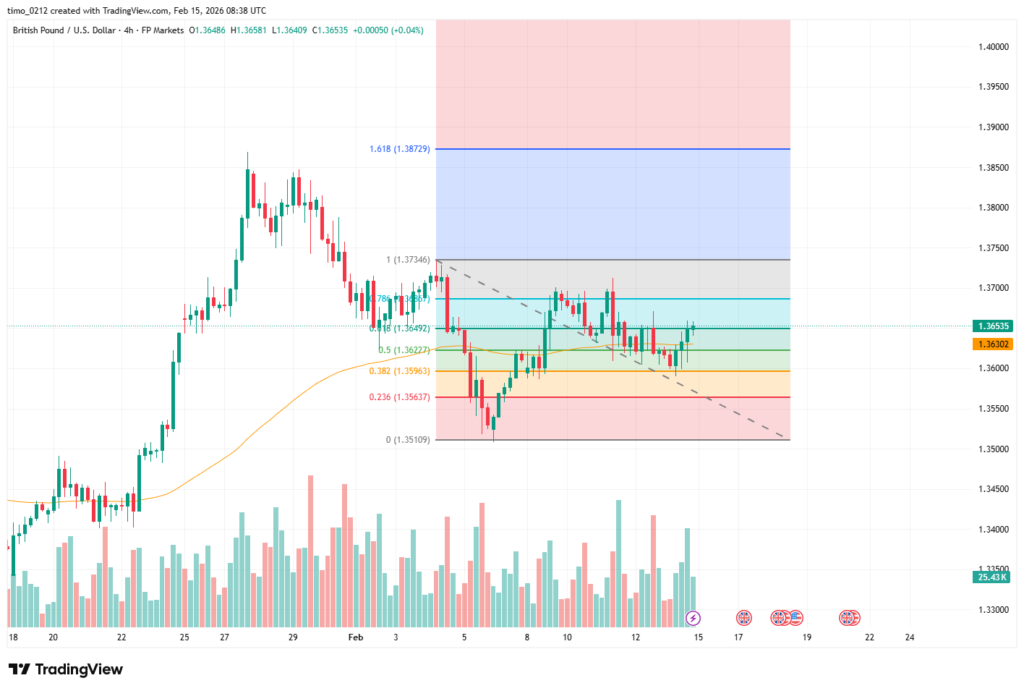
On the H4 timeframe, last week’s correction brought GBP/USD back toward the EMA89 zone multiple times, offering renewed opportunities for traders who previously missed the trend continuation setup.
Although the deepest pullback briefly broke below the EMA89 support, price quickly reclaimed the level and closed back above it. This recovery reinforces EMA89 as a key dynamic support and supports the continuation of the current bullish structure.
Trading Plan for GBP/USD – Week Ahead
For traders currently holding positions, if partial profits have already been secured at TP1 around 1.37xx, you may consider holding the remaining position toward TP2 near 1.38xx. For those still fully in the trade, a prudent approach would be to take partial profit again if price revisits TP1 next week, ensuring gains are protected and avoiding the risk of turning a winning position into a loss.
For traders without an active position, potential Buy setups may be considered near the EMA89 support zone at 1.362x–1.363x, provided price shows bullish confirmation upon retest. Stop Loss should be placed below 1.35, while Take Profit targets remain aligned with the levels outlined above.
USD/CHF Weekly Analysis
USD/CHF Last Week Review
Missed the last USD/CHF breakdown? Review it here.
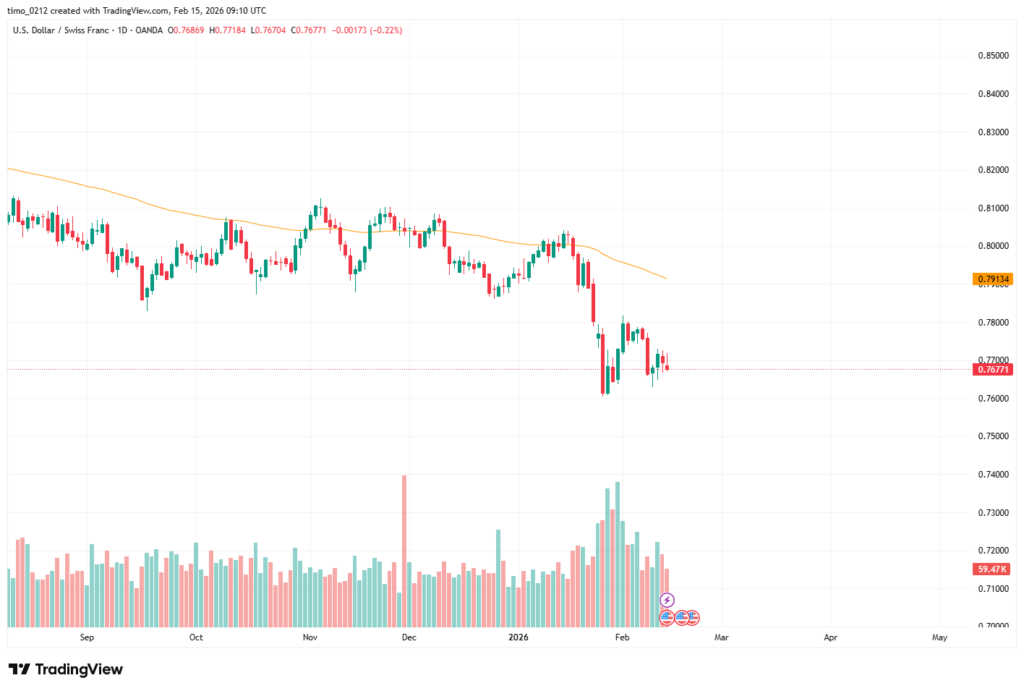
During last week’s trading sessions, USD/CHF opened with a strong bearish candle, signaling clear downside momentum.
The previously identified Buy entry was missed, as price failed to retrace back to the planned entry zone. Had a proper pullback occurred, the setup could have reached TP1 with a risk-to-reward ratio of approximately 1:2. This highlights the importance of patience and disciplined execution when waiting for optimal entry conditions.
USD/CHF Week Ahead Forecast
D1 – Trading Below EMA89
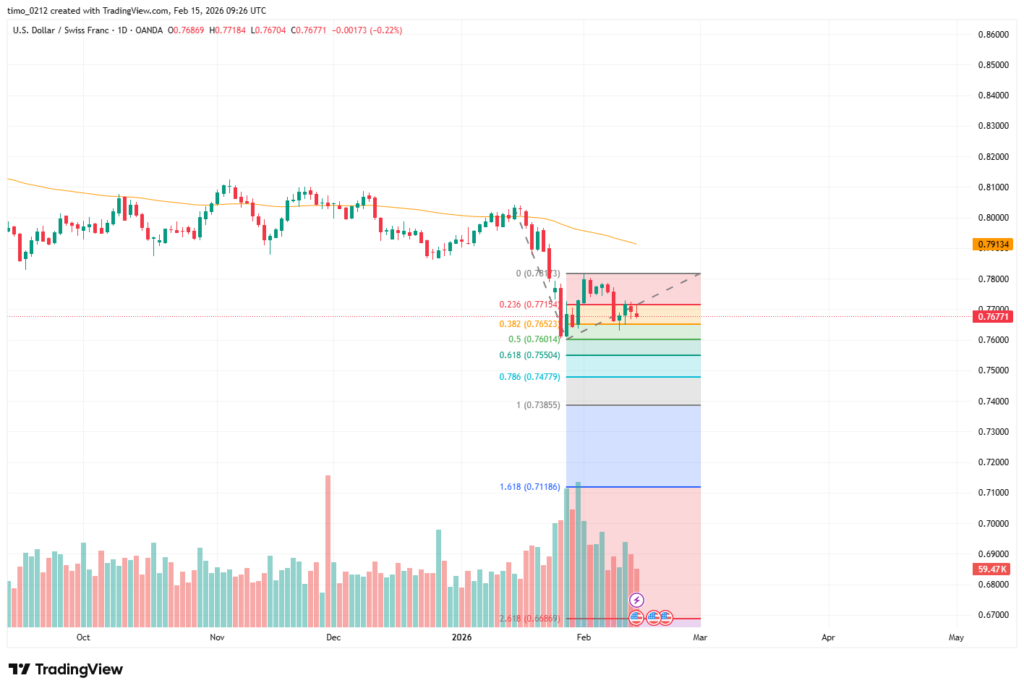
On the D1 timeframe, USD/CHF is currently trading below the EMA89 level, indicating short-term bearish pressure within the broader structure. With price positioned under this dynamic resistance, the bias favors potential Sell setups. A retracement back toward the EMA89 zone could provide a favorable opportunity to look for bearish confirmation and align with the prevailing downside momentum.
H4 – Better Sell Opportunity Zone
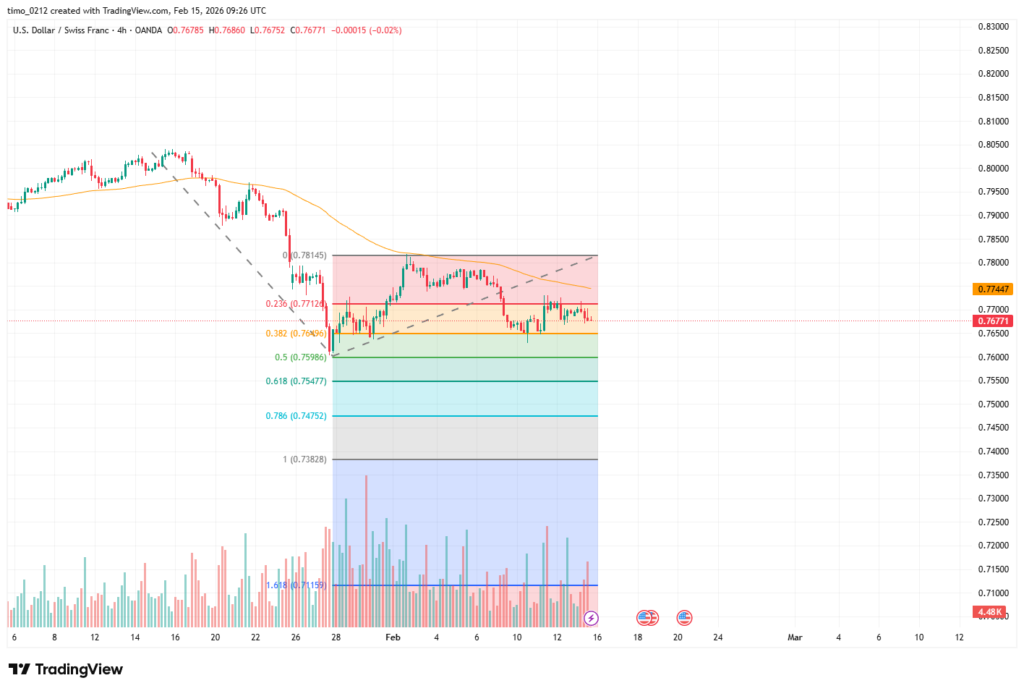
On the H4 timeframe, USD/CHF presents a more precise potential Sell opportunity near the EMA89 zone, around 0.774x–0.778x. This area aligns with dynamic resistance and could offer a favorable risk-to-reward setup if price shows bearish confirmation.
Potential Sell Setup:
- Entry: 0.776x–0.778x
- Stop Loss: 0.78240
- Take Profit: 0.765
- Risk-to-Reward: Approximately 1:1.7
For a more conservative approach, traders may wait for clear consolidation or bearish price action signals around the EMA89 zone before entering the position.
Trading Plan for USD/CHF – Week Ahead
For USD/CHF, the plan remains to wait for a well-structured entry near the EMA89 resistance zone, as outlined in the analysis above. We will only consider execution if price provides clear bearish confirmation and aligns with the prevailing downside momentum. Patience and disciplined risk management remain the priority before entering any new position.
USD/CAD Weekly Analysis
USD/CAD Last Week Review
You can revisit last week’s USD/CAD outlook here.
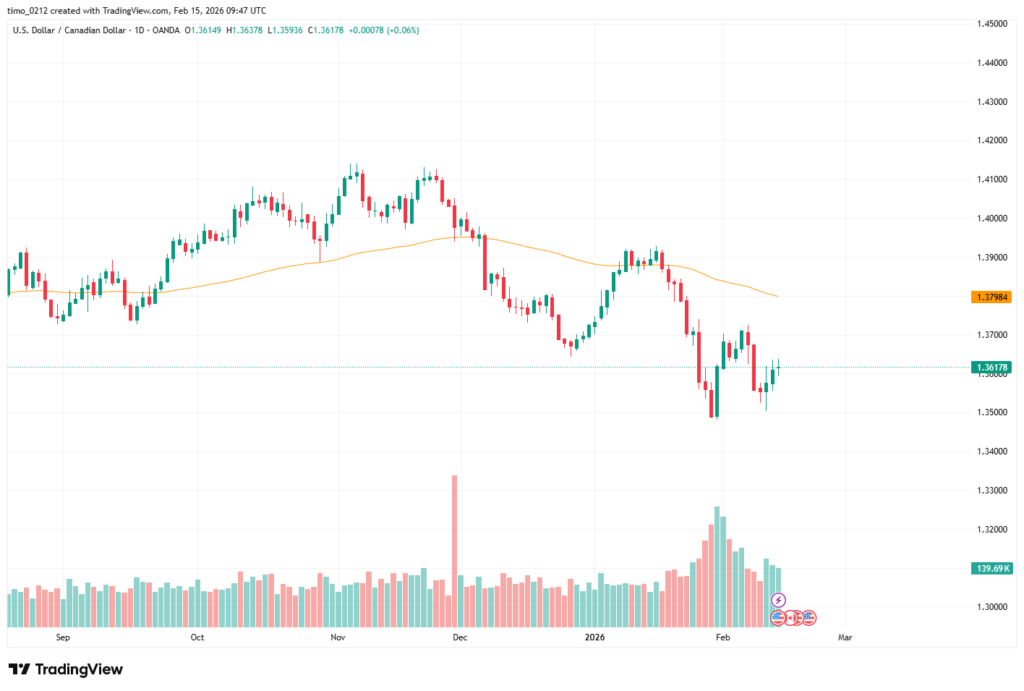
During last week’s trading sessions, USD/CAD began with a strong bearish candle, confirming downside momentum early in the week.
The previously planned entry was missed, as price did not retrace back to the optimal entry zone. Had the pullback occurred, the trade could have reached TP1 with a risk-to-reward ratio of 1:2 and nearly extended toward TP2 with R:R approaching 1:6. This reinforces the importance of patience and waiting for high-probability retracement entries before execution.
USD/CAD Week Ahead Forecast
D1 – Below EMA89 Resistance
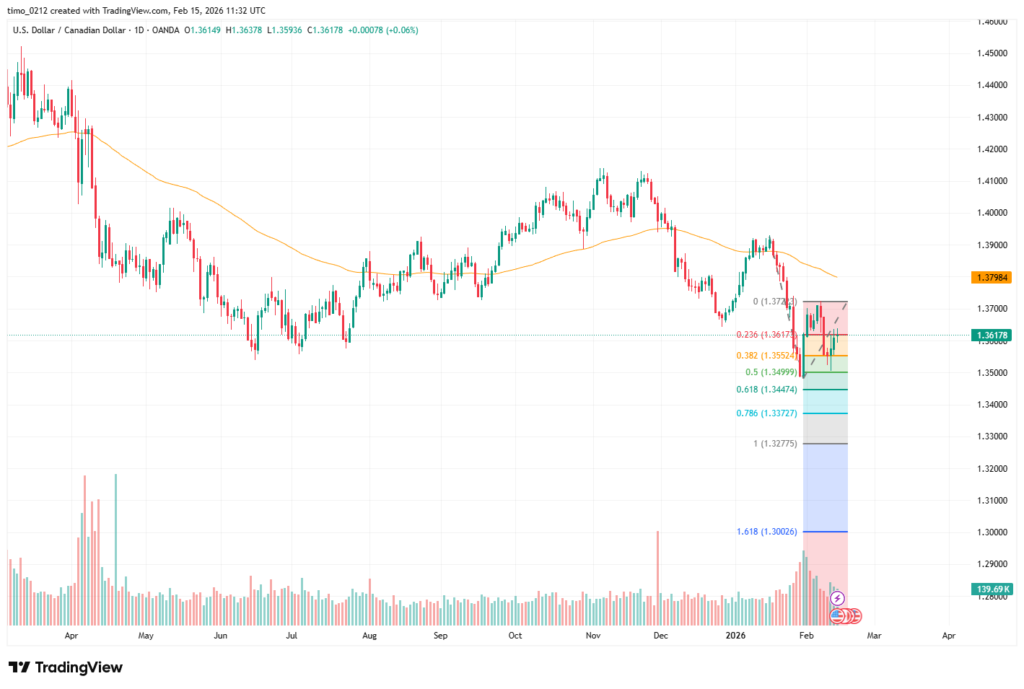
On the D1 timeframe, USD/CAD is currently trading below the EMA89 level, signaling sustained bearish pressure in the short term. Following the previous strong decline, price attempted a corrective rebound toward the Fibonacci 0.5 retracement level before facing renewed selling interest. With the pair positioned under EMA89, the overall bias favors Sell setups. A retracement back toward the EMA89 zone could present a high-probability opportunity to look for bearish confirmation and align with the prevailing downtrend.
H4 – Closer Entry Zone
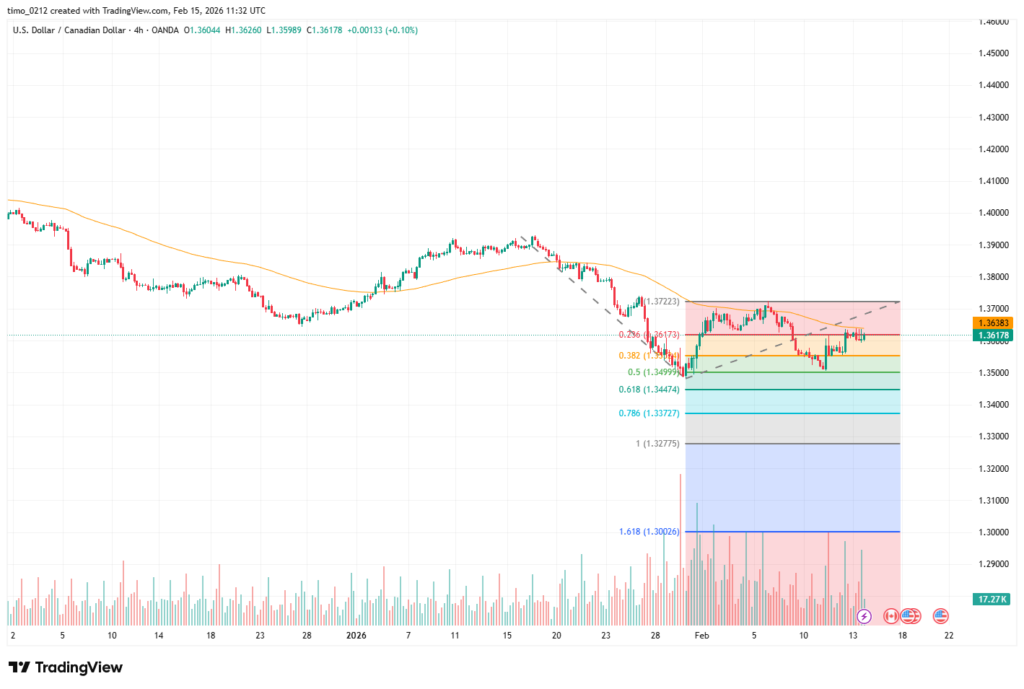
On the H4 timeframe, USD/CAD offers a more refined potential Sell opportunity near the EMA89 dynamic resistance around 1.64x. This level may act as a short-term pullback zone within the broader bearish structure.
Potential Sell Setup:
- Entry: 1.64x
- Stop Loss: 1.37230
- Take Profit: 1.351
- Risk-to-Reward: Approximately 1:1.5
For a more conservative approach, traders may wait for consolidation or clear bearish price action confirmation around the EMA89 zone before executing the trade.
Trading Plan for USD/CAD – Week Ahead
For USD/CAD, the strategy remains focused on waiting for a high-probability entry near the EMA89 resistance zone, as outlined in the analysis above. Patience is essential — we will only consider execution once price provides clear bearish confirmation and aligns with the prevailing trend structure.
Rome wasn’t built in a day — consistent discipline and proper risk management matter more than rushing into a trade.
NZD/USD Weekly Analysis
NZD/USD Last Week Review
If you haven’t seen our NZD/USD analysis from last week, find it here.
During last week’s trading sessions, NZD/USD opened on Monday with a strong bullish candle, confirming the continuation of the uptrend. The price action was highly correlated with EUR/USD and GBP/USD, reflecting broad USD weakness across major pairs.
However, despite the clear bullish momentum, the previous entry plan was not triggered, as price rallied aggressively without providing a proper pullback into the optimal entry zone. This highlights how strong trend conditions can sometimes limit retracement opportunities for structured entries.
NZD/USD Week Ahead Forecast
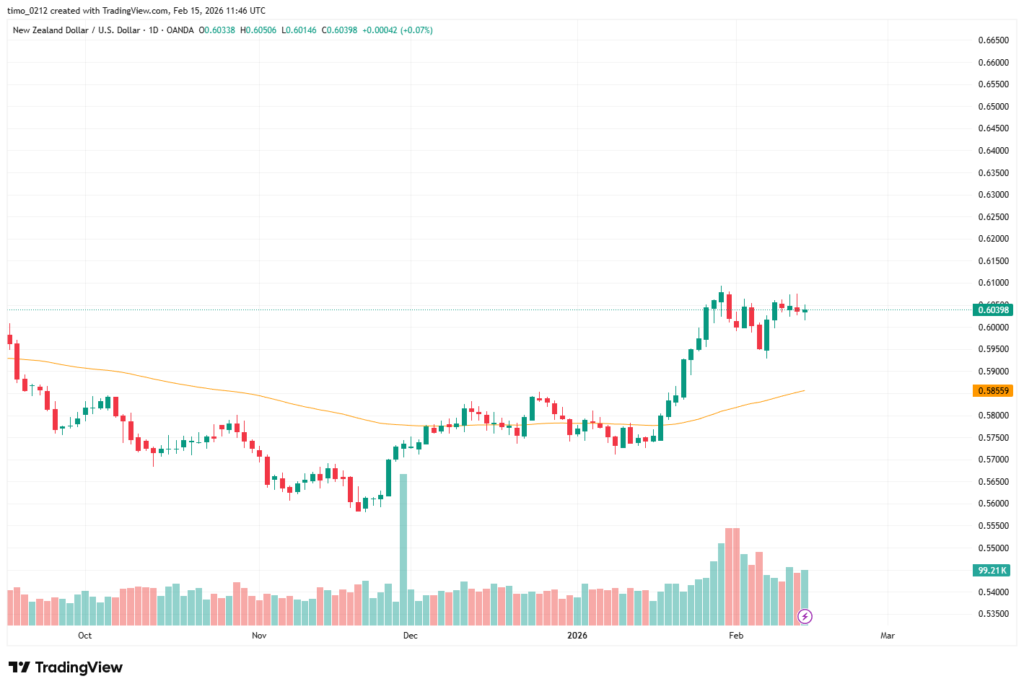
D1 – Strong Bullish Momentum
On the D1 timeframe, NZD/USD is trading well above the EMA89 dynamic support, highlighting strong bullish momentum in the current market structure. The significant distance between price and EMA89 reinforces the strength of the ongoing uptrend, indicating sustained buying pressure as long as the pair remains above this key moving average.
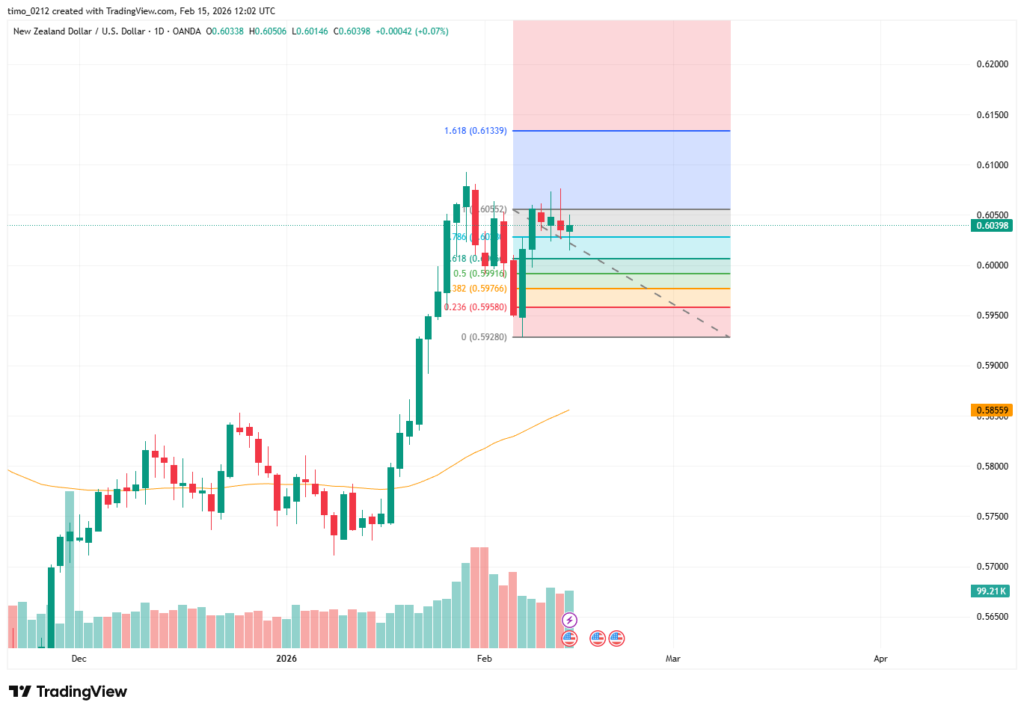
H4 – Buy-the-Dip Strategy
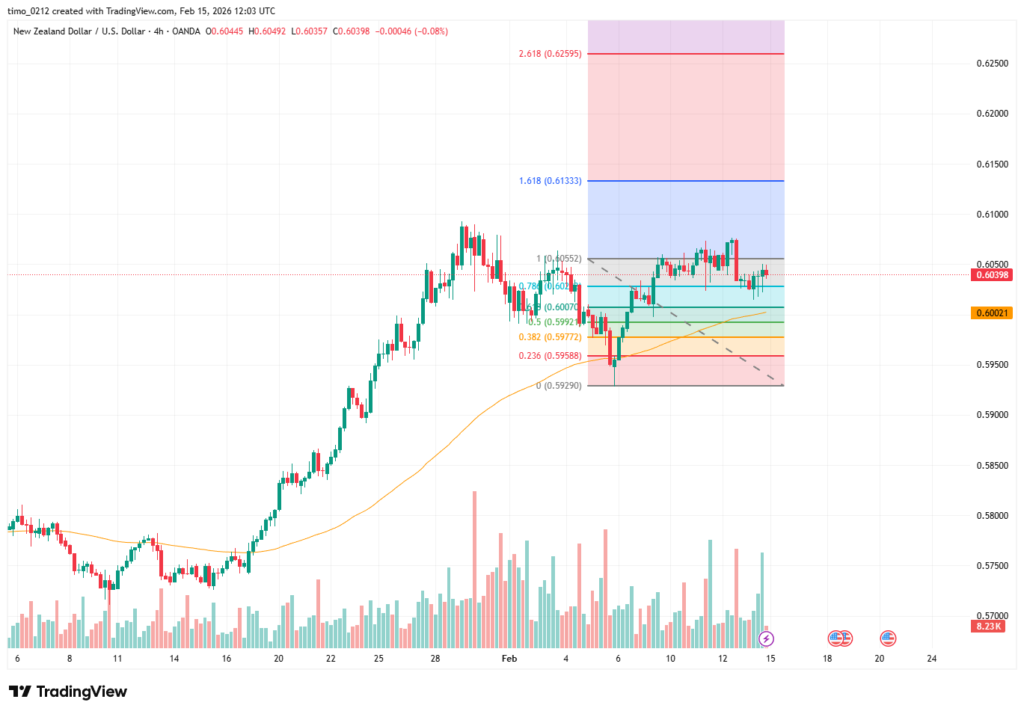
On the H4 timeframe, NZD/USD may offer a potential Buy-the-dip opportunity near the EMA89 dynamic support, aligning with the broader bullish trend on D1. A pullback toward this level could provide a more structured entry for trend continuation.
Potential Buy Setup:
- Entry: 0.60x
- Stop Loss: 0.5924
- Take Profit: 0.608x
- Risk-to-Reward: Approximately 1:1.16
For a more conservative approach, traders may wait for consolidation or clear bullish price action confirmation around the EMA89 zone before entering the position.
Trading Plan for NZD/USD – Week Ahead
For NZD/USD, the approach remains to wait patiently for a structured pullback entry near the EMA89 zone, as outlined above. While this is a major currency pair with strong bullish momentum, the current setup offers a relatively modest risk-to-reward profile, close to 1:1. Therefore, disciplined position sizing and strict risk management are essential before committing to the trade.
AUD/USD Weekly Analysis
AUD/USD Last Week Review
Catch up on last week’s AUD/USD forecast here.

During last week’s trading sessions, AUD/USD printed strong bullish candles on Monday and Tuesday, breaking above the previous swing high and confirming continued upside momentum. The breakout reinforced the prevailing bullish trend across the pair. However, despite the clear strength, the previously planned entry was not triggered, as price advanced aggressively without offering a proper pullback into the optimal Buy zone. This reflects strong trend conditions where momentum limits retracement opportunities for structured entries.
AUD/USD Week Ahead Forecast
D1 – Strong Bullish Trend
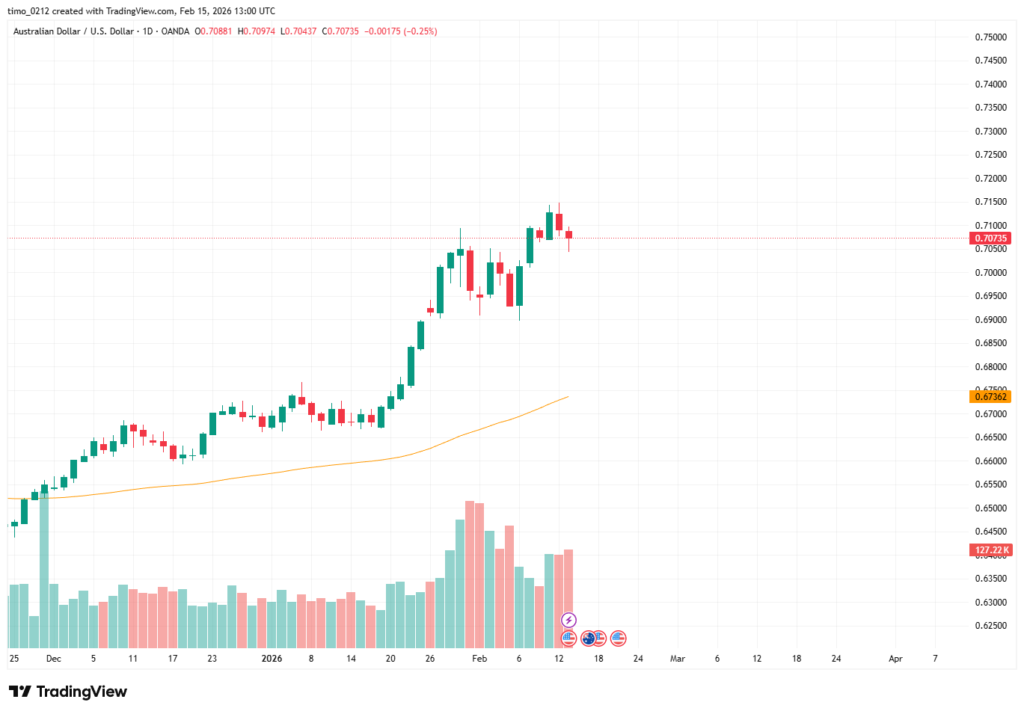
On the D1 timeframe, AUD/USD remains in a strong bullish trend, with price trading significantly above the EMA89 dynamic support. The wide distance between price and EMA89 highlights sustained upward momentum and confirms that the broader uptrend is still intact. As long as the pair holds above this key moving average, the bullish structure remains valid.
H4 – Pullback Buy Opportunity
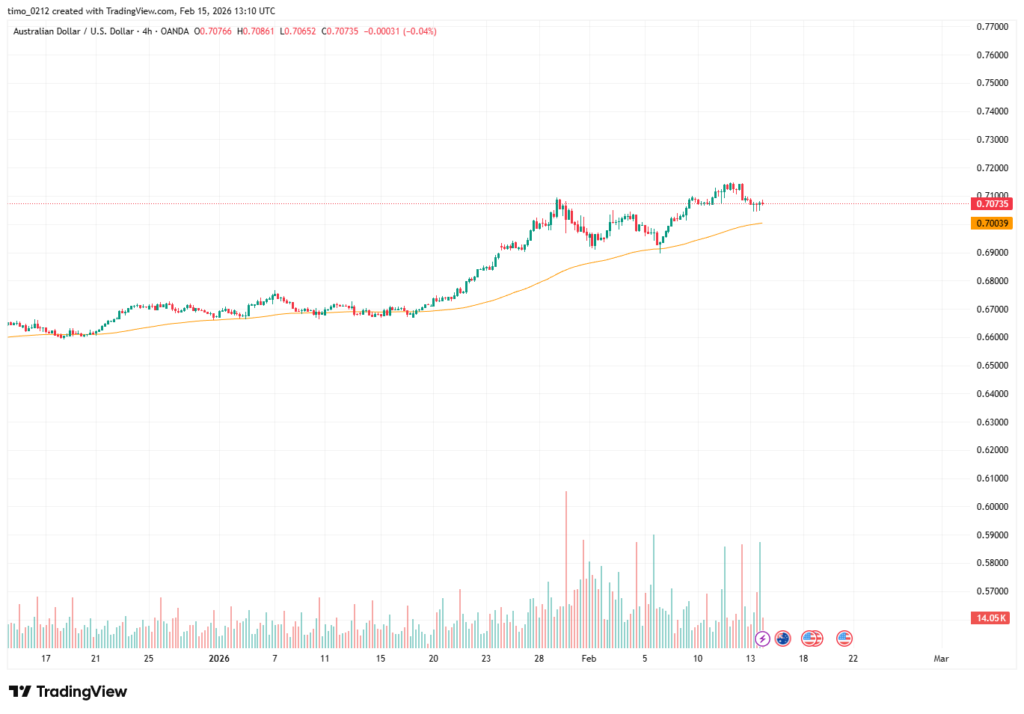
On the H4 timeframe, AUD/USD may present a potential Buy opportunity near the EMA89 dynamic support, aligning with the strong bullish structure observed on the higher timeframe. A controlled pullback toward this level could offer a favorable entry for trend continuation.
Potential Buy Setup:
- Entry: 0.70x
- Stop Loss: 0.688
- Take Profit: 0.713x
- Risk-to-Reward: Approximately 1:1.4
For a more conservative strategy, traders may wait for consolidation or clear bullish price action confirmation around the EMA89 zone before executing the trade.
Trading Plan for AUD/USD – Week Ahead
For AUD/USD, the strategy remains focused on patience and disciplined execution. We will wait for a high-probability entry near the EMA89 support zone, as outlined above, before considering any Buy positions. A confirmed pullback with bullish price action will provide stronger confluence and improve overall risk-to-reward alignment. Until then, avoiding impulsive entries and waiting for optimal market structure is the preferred approach.