EUR/USD Analysis
Daily Timeframe (D1)
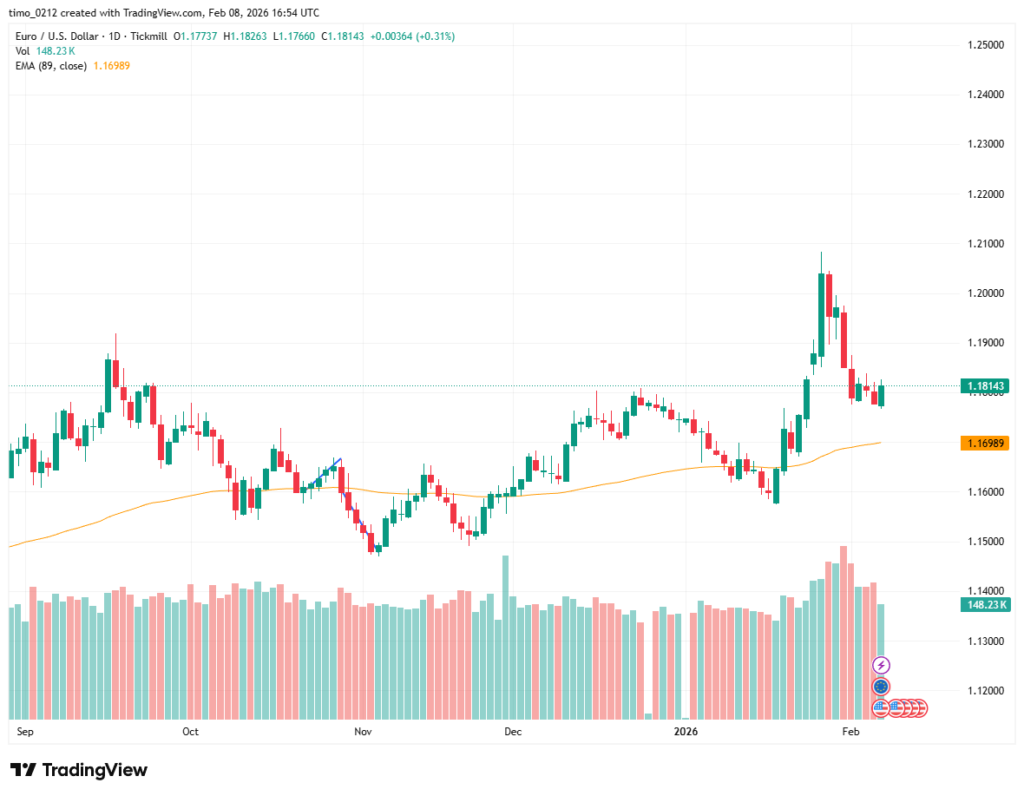
On the D1 timeframe, EUR/USD is currently trading above the EMA 89, indicating that the broader bullish structure remains intact.
After a strong rally toward the 1.21 area, price experienced a corrective decline and is now moving sideways. This consolidation above EMA 89 suggests that the market may be building a base before the next directional move.
To identify higher-probability trade opportunities, we move down to the H4 timeframe for more precise entries.
H4 Timeframe
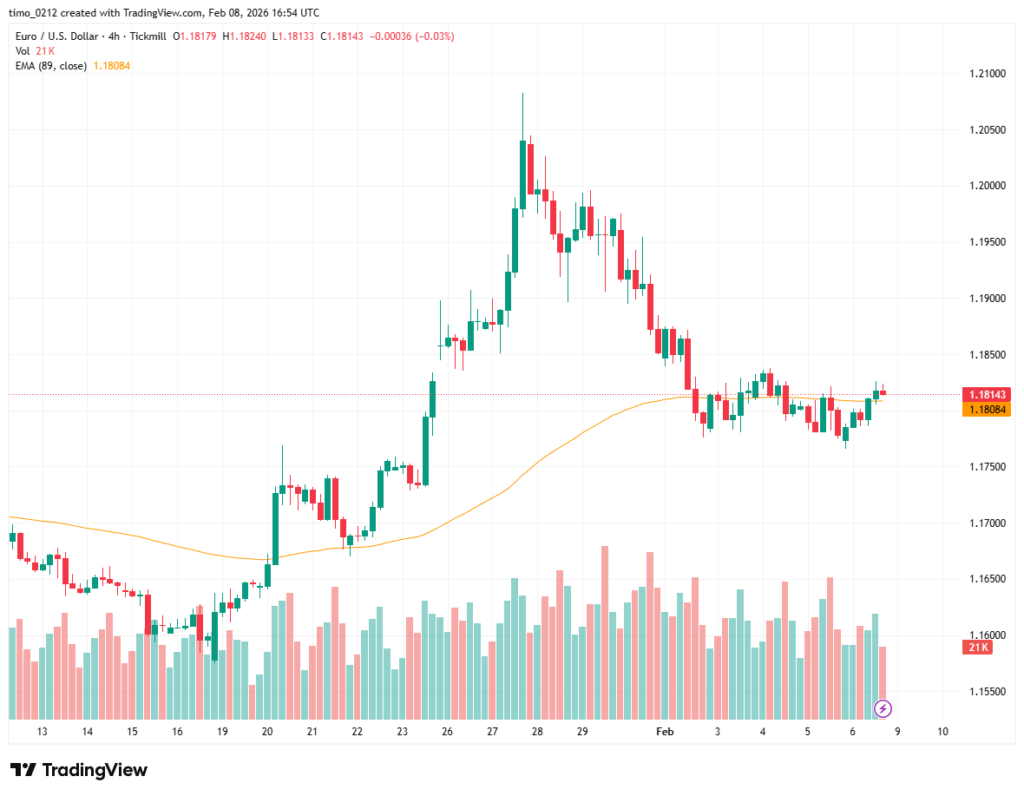
On the H4 chart, EUR/USD previously pulled back below EMA 89 during the corrective phase, but price quickly reclaimed this level and is now trading back above EMA 89.
This behavior shows that EMA 89 is acting as dynamic support, making the area around this level a potential Buy zone aligned with the higher-timeframe bias.
Trade Plan (EUR/USD):
- Entry: 1.1810
- Stop Loss: 1.1765
- Take Profit 1: 1.186x
- Take Profit 2: 1.194x
Every trade involves risk. Always define how much you are willing to lose before thinking about potential profits.
USD/JPY Analysis
Daily Timeframe (D1)
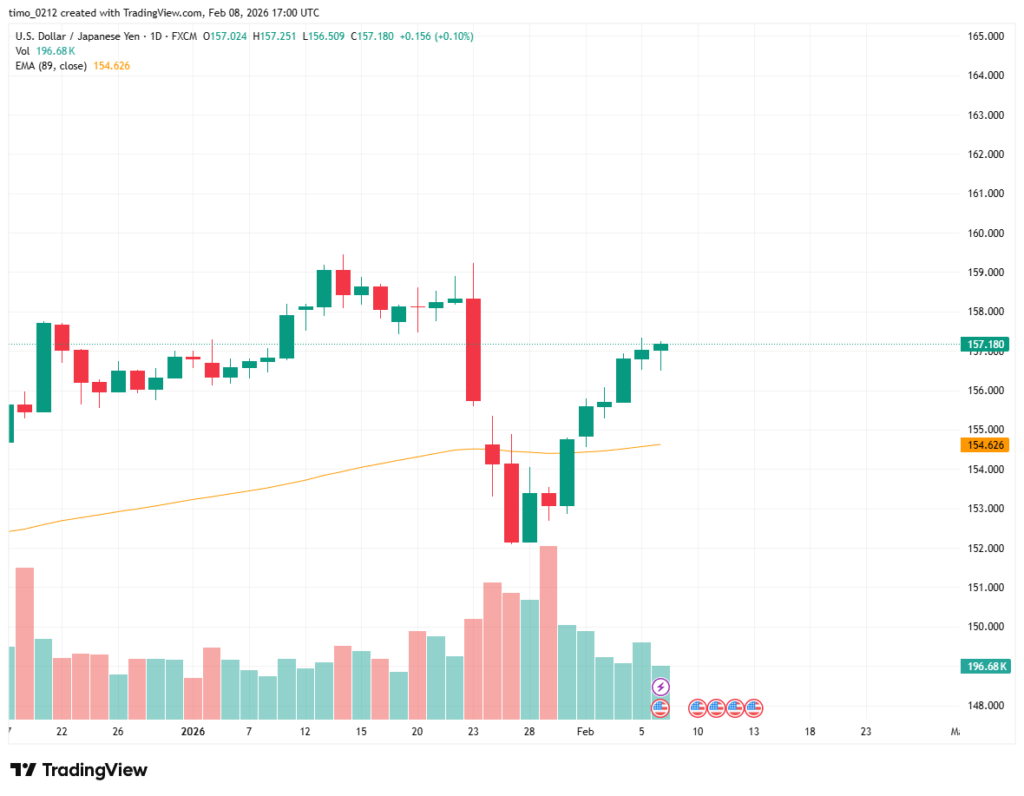
On the D1 chart, USD/JPY previously experienced a sharp decline that broke below the EMA 89. However, price has since reclaimed and moved decisively above EMA 89, signaling a return to a bullish trend on the higher timeframe.
This recovery above EMA 89 shifts the overall bias back toward Buy-side opportunities.
H4 Timeframe
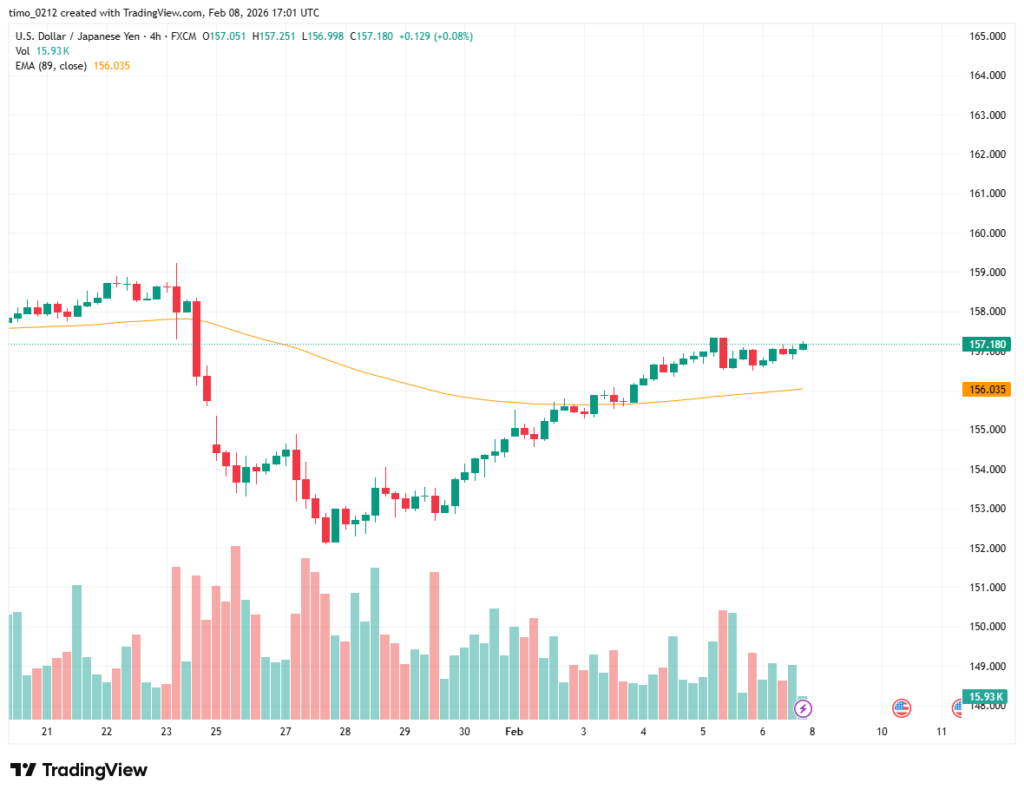
Zooming into the H4 timeframe, price offered a clear Buy opportunity around the EMA 89 level after successfully breaking above it.
This setup was discussed in a previous analysis, which you can review for additional context. As long as price remains above EMA 89, the bullish structure remains valid.
Next bullish expectation:
- Target zone around 158 – 159
GBP/USD Analysis
Daily Timeframe (D1)
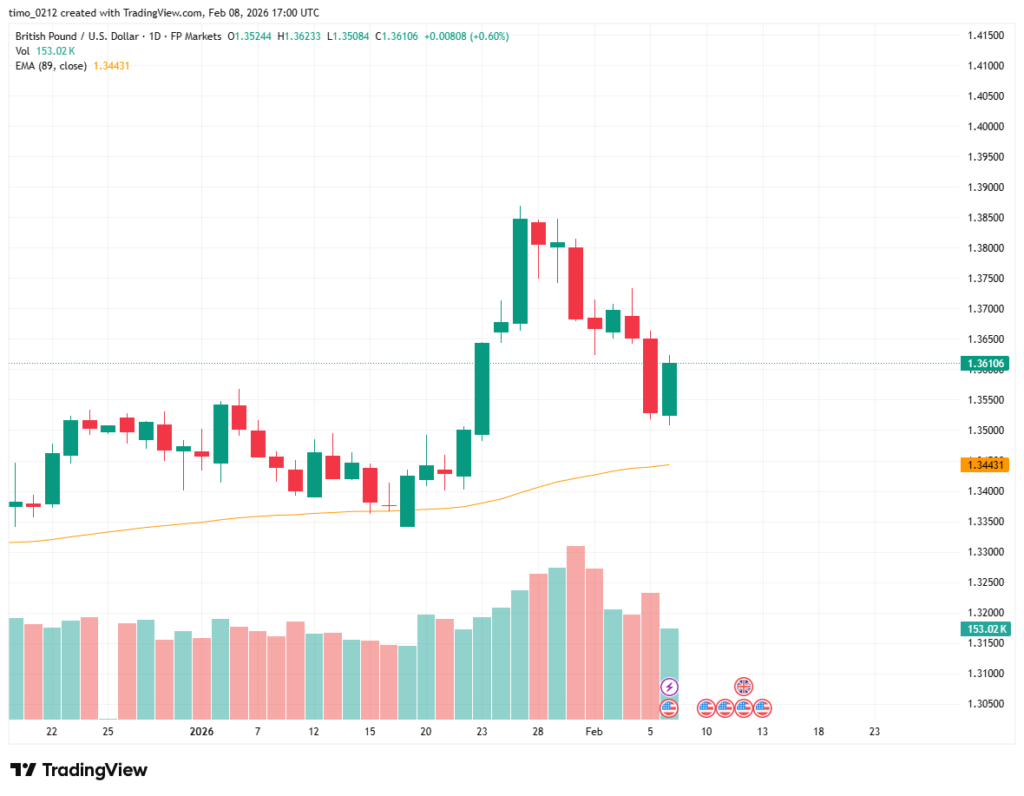
On the daily chart, GBP/USD previously rallied strongly toward the 1.39 area, followed by a sharp correction. During last Friday’s session, the pair showed a strong bullish rebound, suggesting renewed buying interest.
To refine potential entry zones, we move to the H4 timeframe.
H4 Timeframe
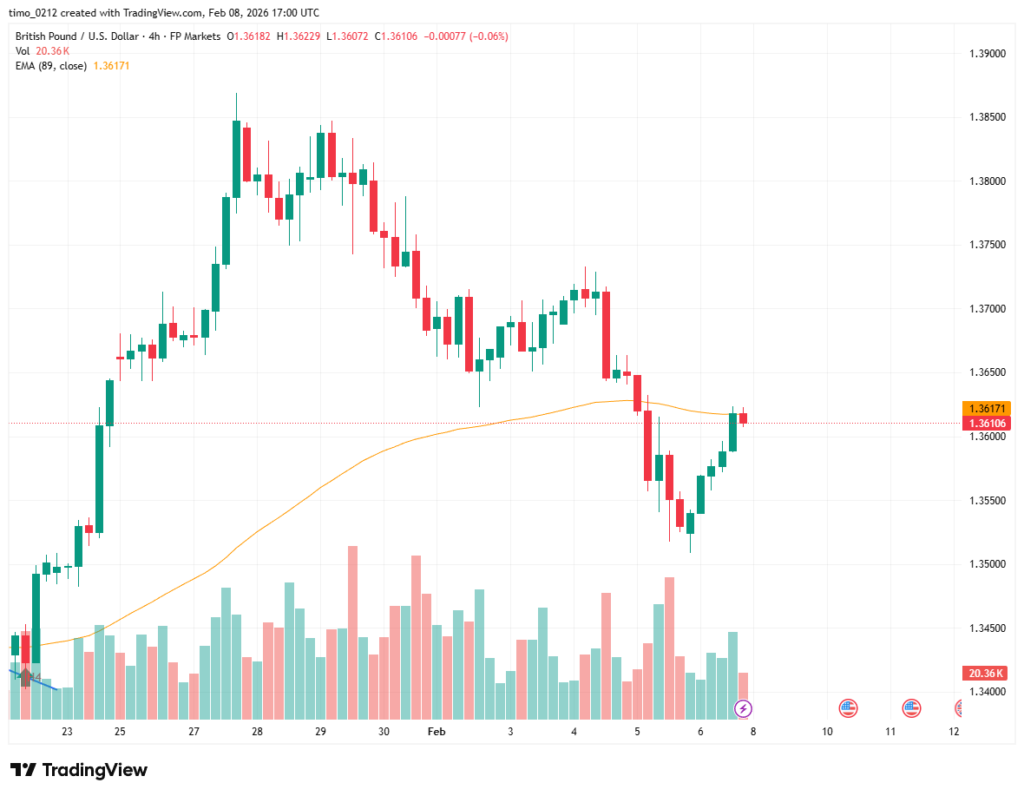
On H4, GBP/USD is currently pulling back toward the EMA 89 support zone. This level has historically acted as a key dynamic support within the trend.
As long as price holds around EMA 89, this area can be considered a potential Buy setup aligned with the higher-timeframe structure.
Trade Plan (GBP/USD):
- Entry: 1.3618x
- Stop Loss: Below 1.3500
- Take Profit 1: 1.37xxx (R:R ≈ 1:1)
- Take Profit 2: 1.38xxx (R:R ≈ 1:2)