
EUR/USD Analysis
H4 Timeframe – Bullish Correction Within an Uptrend
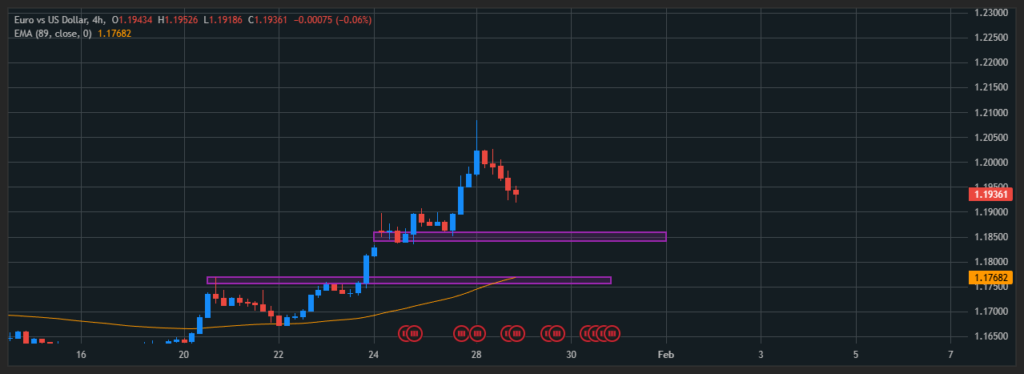
On the H4 timeframe, EUR/USD is currently experiencing a technical pullback after a strong bullish move toward the 1.2100 area. Despite this correction, the overall market structure remains bullish, as price continues to trade above the EMA 89, indicating that the uptrend is still intact rather than a trend reversal.
At this stage, the pullback can be viewed as a healthy correction within an uptrend, and we will shift to a lower timeframe to look for potential continuation setups.
H1 Timeframe – Watching EMA89 as Key Support
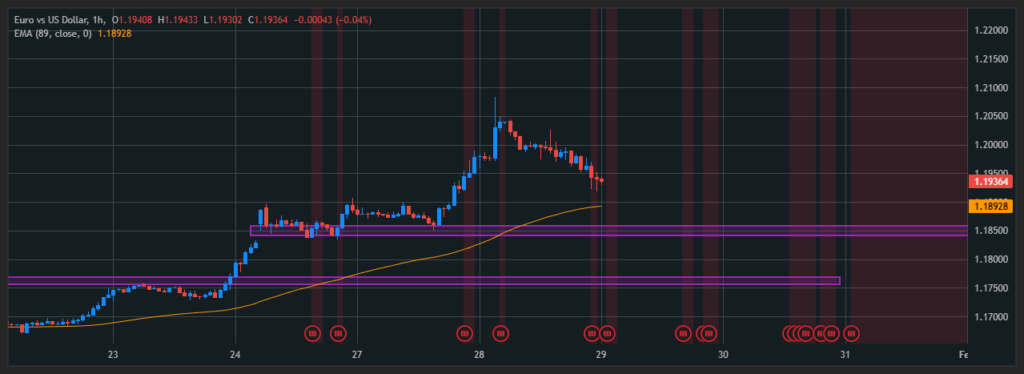
On the H1 timeframe, price is approaching the EMA 89 support zone, which aligns well with the higher-timeframe bullish structure. This area is worth monitoring closely.
If EMA 89 holds as support and price shows bullish reaction, EUR/USD could offer a potential Buy opportunity, targeting a continuation move in line with the dominant H4 trend. Confirmation from price action around this zone will be key before considering any entries.
CHF/JPY Analysis
H4 Timeframe – Bullish Break Above EMA89
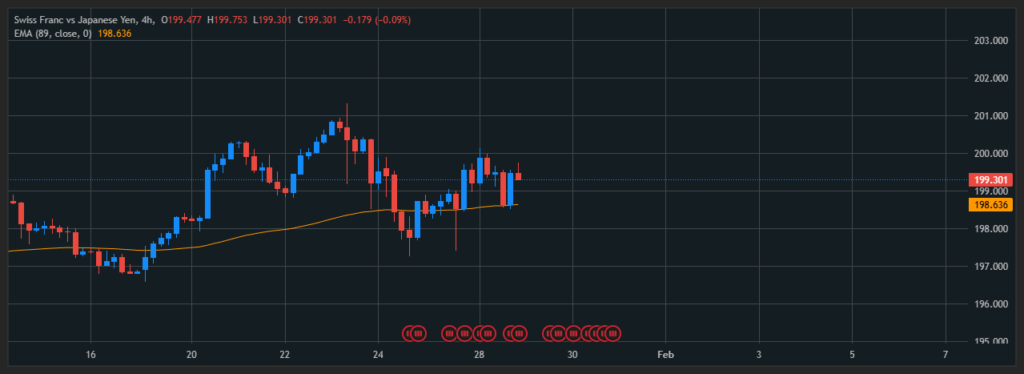
On the H4 chart, CHF/JPY has clearly broken above the EMA 89 and is now trading firmly above this dynamic support level. This breakout suggests a shift to bullish momentum on the higher timeframe.
With price holding above EMA 89, the market structure favors long-side opportunities, provided lower timeframes support the setup.
H1 Timeframe – Buy-the-Dip Scenario
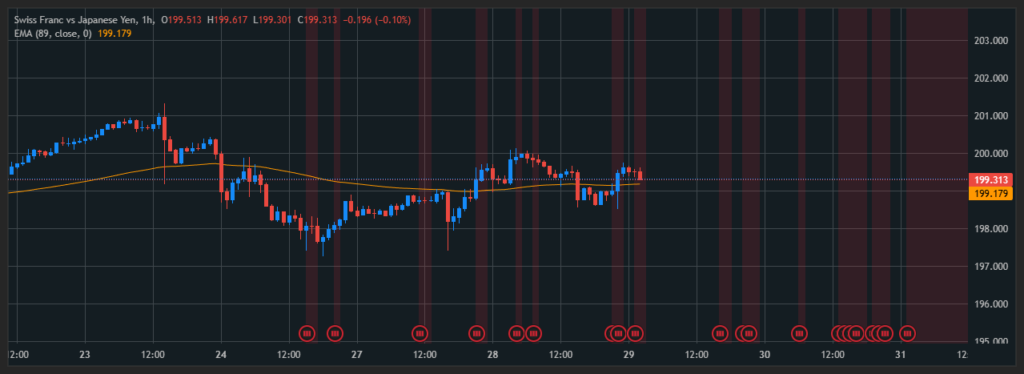
Zooming into the H1 timeframe, CHF/JPY continues to trade above EMA 89, reinforcing the short-term bullish bias. In this context, pullbacks toward the EMA 89 zone may offer high-probability Buy setups, as long as price remains above this level.
This approach allows traders to align short-term entries with the higher-timeframe H4 uptrend, improving overall trade confluence.
EUR/GBP Analysis
H4 Timeframe – Short-Term Bearish Shift
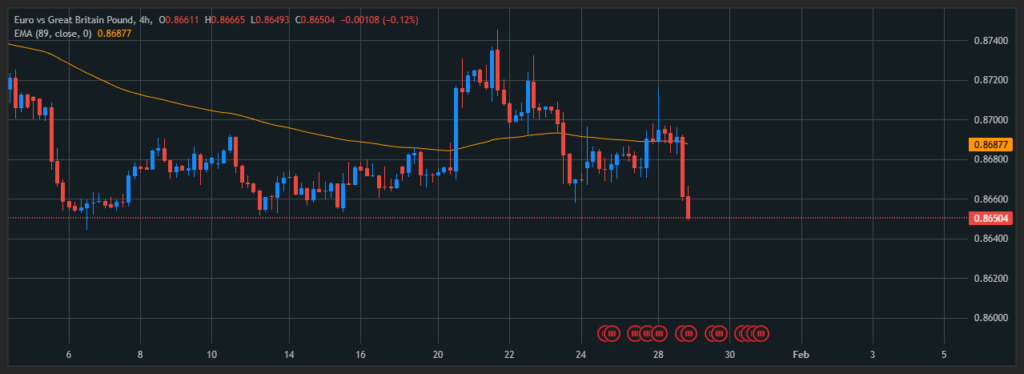
On the H4 timeframe, EUR/GBP has printed a strong bearish candle that decisively broke below the EMA 89, signaling a potential short-term trend reversal. This breakdown suggests increasing selling pressure and opens the door for a short-term bearish move.
Given this structure, buying against the move is not favored at the moment.
H1 Timeframe – Looking for Sell on Pullback
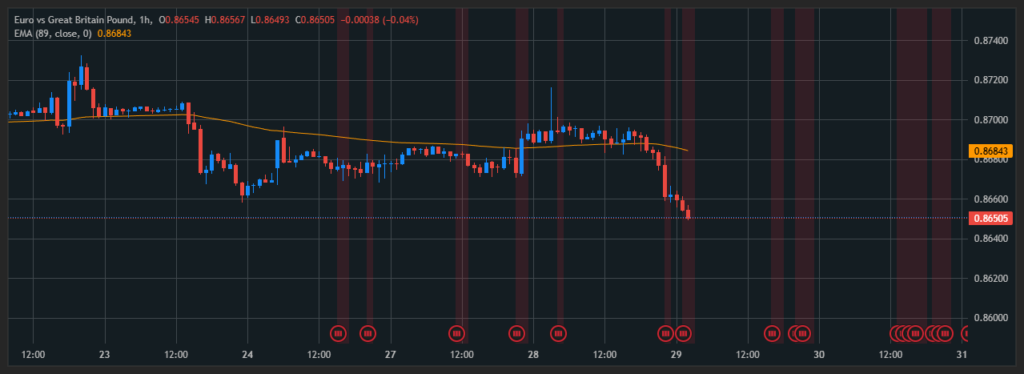
On the H1 chart, the bearish momentum from the H4 timeframe is clearly reflected, with price continuing to trade below EMA 89. In this scenario, traders can look for Sell opportunities on pullbacks toward the EMA 89 area around 0.868xx.
If price reacts bearishly from this zone, it could provide a favorable Sell setup, aligning with both the H1 and H4 bearish bias.