
This daily Forex market analysis provides a multi-timeframe technical overview of key currency pairs, focusing on price action behavior around major EMA levels and overall trend structure. The analysis is intended for educational purposes and reflects a personal market perspective.
EUR/USD Analysis
EUR/USD – H4 Timeframe
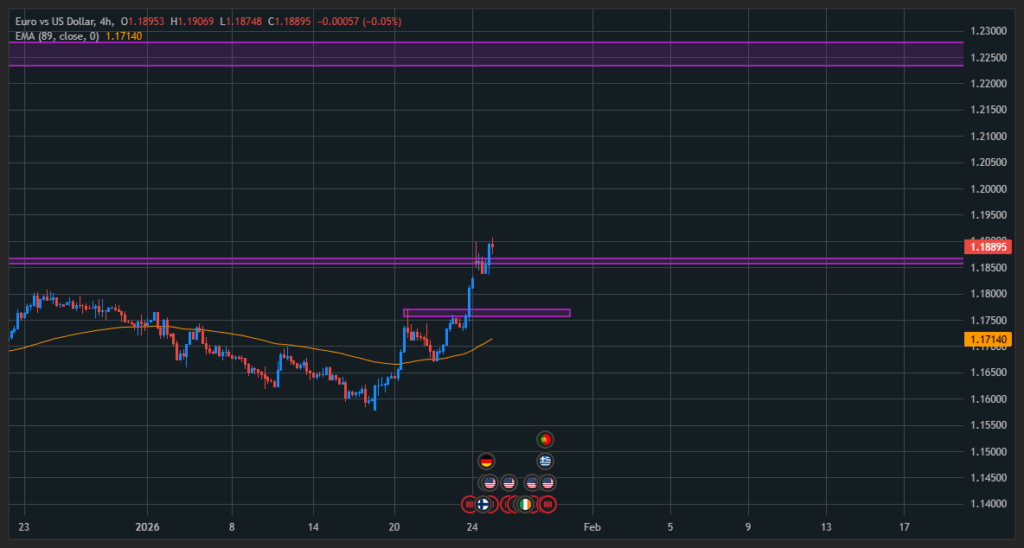
On the H4 chart, EUR/USD opened the week with a bullish gap and began trading around the former resistance zone near 1.186xx. Price has decisively broken above this resistance level, confirming bullish continuation.
However, it is important to note that price is currently trading far above the EMA89, which acts as a dynamic support in trending markets. When price extends too far from this level, the risk of chasing becomes higher. For better clarity, we move to a lower timeframe.
EUR/USD – H1 Timeframe
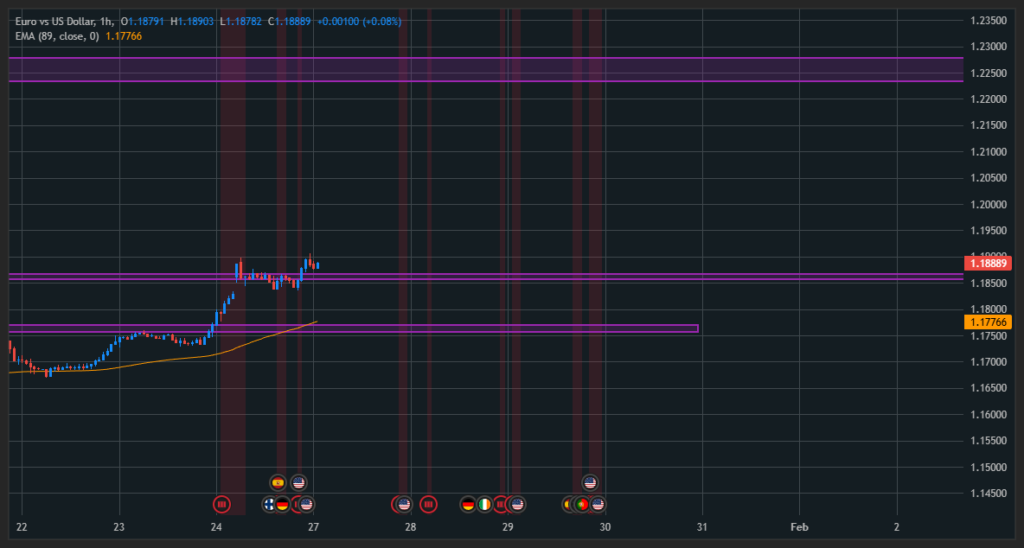
On the H1 chart, the bullish gap and breakout structure remain clearly visible. Price continues to trade well above the EMA89, showing strong momentum but no optimal risk-to-reward entry at this stage.
This is not an ideal area to enter Buy positions due to overextension, and it is also not a Sell zone, as the broader trend remains bullish. Selling against a strong trend carries unnecessary risk. Let’s observe the lower timeframe for refinement.
EUR/USD – M15 Timeframe
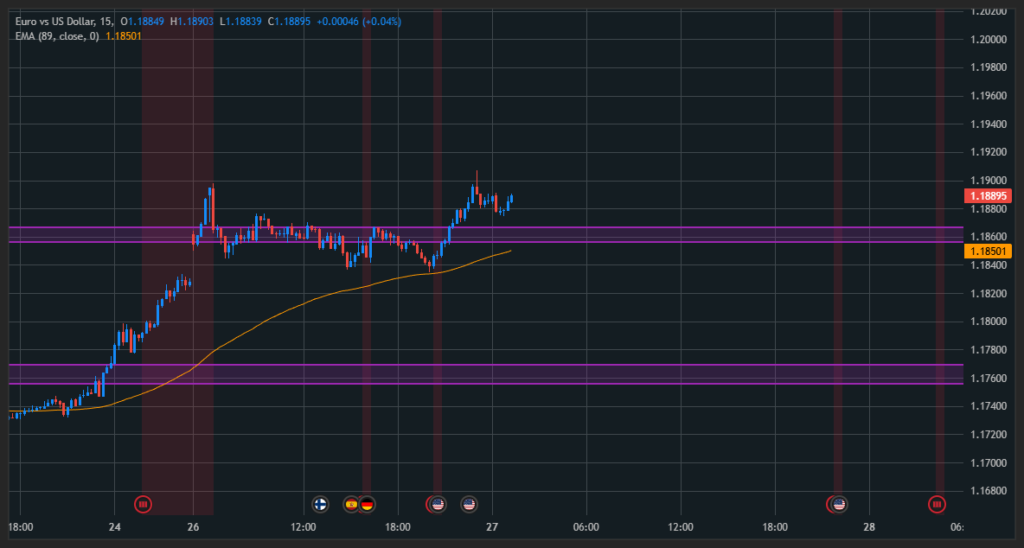
On the M15 chart, price previously corrected back toward the EMA89 before bouncing higher, reinforcing the bullish structure and confirming the EMA89 as a short-term dynamic support.
From my perspective, the preferred approach is to wait for another controlled pullback toward the EMA89 zone. A reaction from this area would offer a higher-probability Buy opportunity aligned with the prevailing trend.
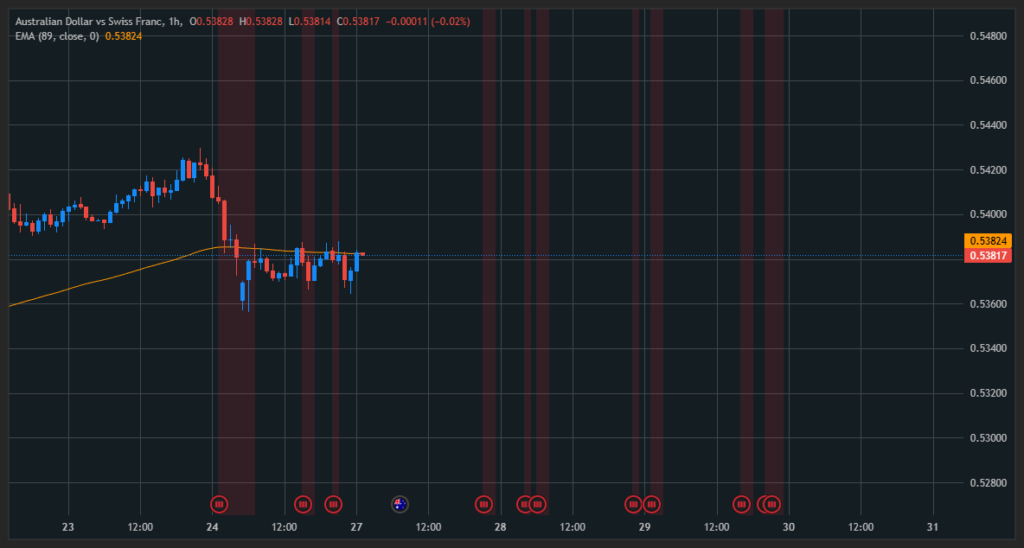
AUD/CHF Analysis
AUD/CHF – H4 Timeframe
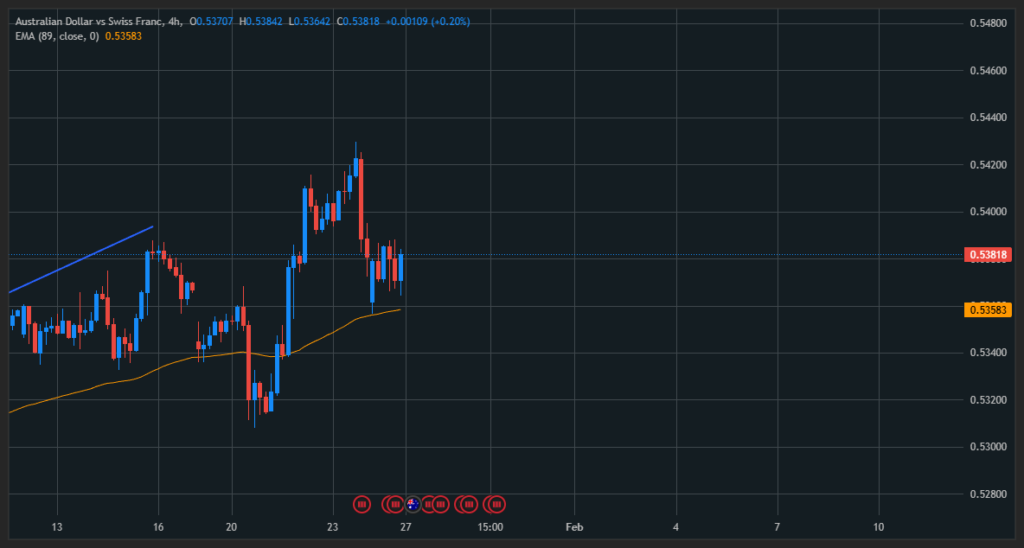
On the H4 timeframe, AUD/CHF has shown strong bullish momentum after breaking above the EMA89 and successfully pushing through the previous high around 0.538xx.
Following this breakout, price has entered a corrective phase, which is a normal behavior after impulsive moves. To assess potential continuation, we move to a lower timeframe.
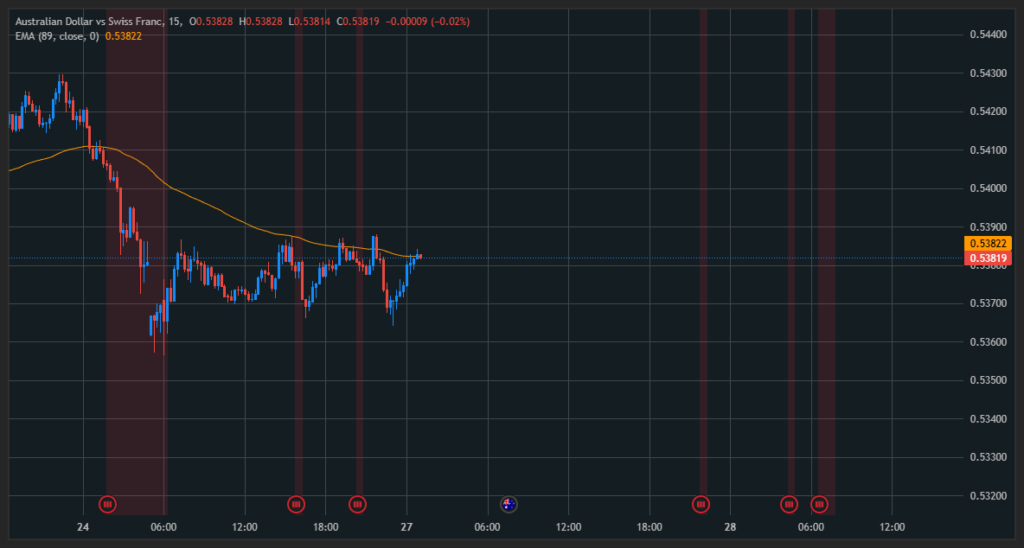
AUD/CHF – H1 Timeframe
On the H1 chart, AUD/CHF is currently trading around the EMA89 near the 0.538xx area. The previous candle closed above the EMA89, suggesting that this level may now act as a short-term support.
Given that the higher timeframe (H4) remains bullish, this zone can be considered a favorable Buy area, as it aligns with the dominant trend structure.
Buy Setup (Trend-Continuation Idea):
- Entry: 0.5382x
- Stop Loss: Below 0.5355x (approximately 26 pips)
- Take Profit: Near the recent high at 0.542xx (approximately 40 pips)
AUD/CHF – M15 Timeframe
On the M15 chart, price continues to close above the EMA89, confirming that short-term support remains intact.
This lower-timeframe behavior supports the H1 Buy idea, as it shows that buyers are still defending the EMA89 area. As long as this structure holds, the setup remains technically valid.
AUD/JPY Analysis
AUD/JPY – H4 Timeframe
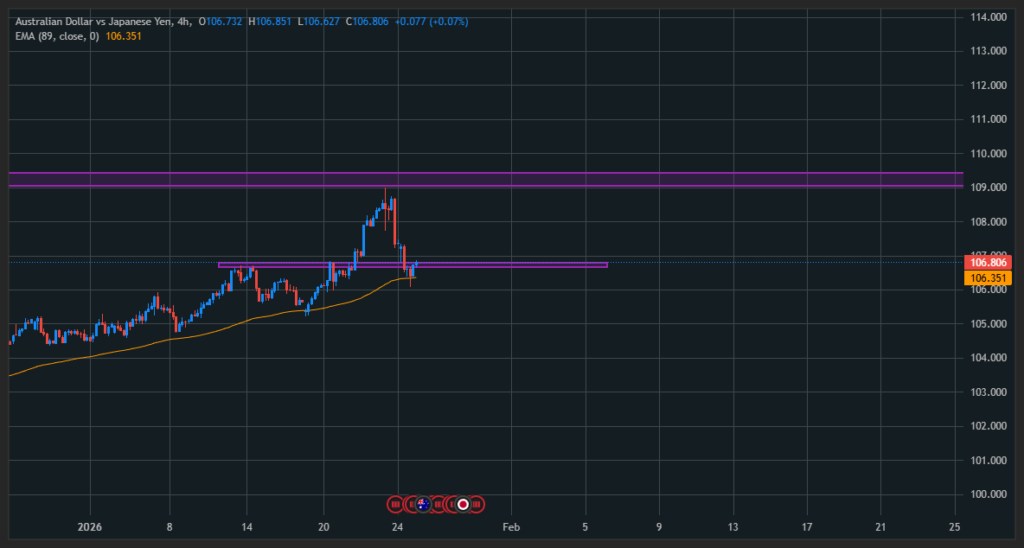
From a broader perspective on the H4 chart, AUD/JPY remains within a bullish trend, with price consistently respecting the EMA89 as a dynamic support.
Previously, the pair corrected toward the EMA89 near 105.3, then broke above the prior high at 106.8, continued toward 109, and later pulled back again toward the EMA89 around 106.34.
While the EMA89 area is a potential Buy zone, confirmation from lower timeframes is still required. Let’s examine the H1 chart.
AUD/JPY – H1 Timeframe
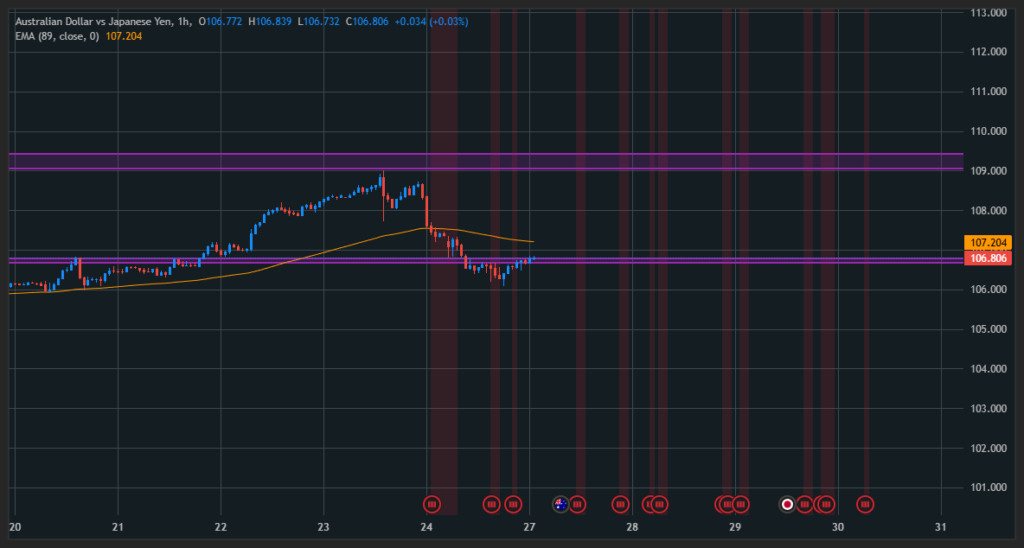
On the H1 timeframe, price is currently trading below the EMA89, indicating a short-term bearish structure within the broader bullish trend.
For a safer entry, I prefer to wait for clear confirmation, specifically a candle close back above the EMA89 on H1. Trend confirmation is more important than catching a few early pips. If the setup fails, accepting a controlled loss and waiting for the next opportunity is always part of the process.
Conditional Buy Plan:
- Entry: 107.205 (only if price closes above EMA89 on H1)
- Stop Loss: 106.00
- Take Profit: 108.653