
This is my first daily market analysis published on FXTradingToday.
The purpose of this daily analysis series is simple:
to understand the market context before making any trading decisions.
I personally use this analysis to prepare my bias for the day.
Readers can use it as a reference — and if you have a different perspective, feel free to leave a comment so we can exchange ideas.
Note: This analysis reflects my personal technical view and is not financial advice.
EUR/USD Analysis
EUR/USD – H4 Timeframe
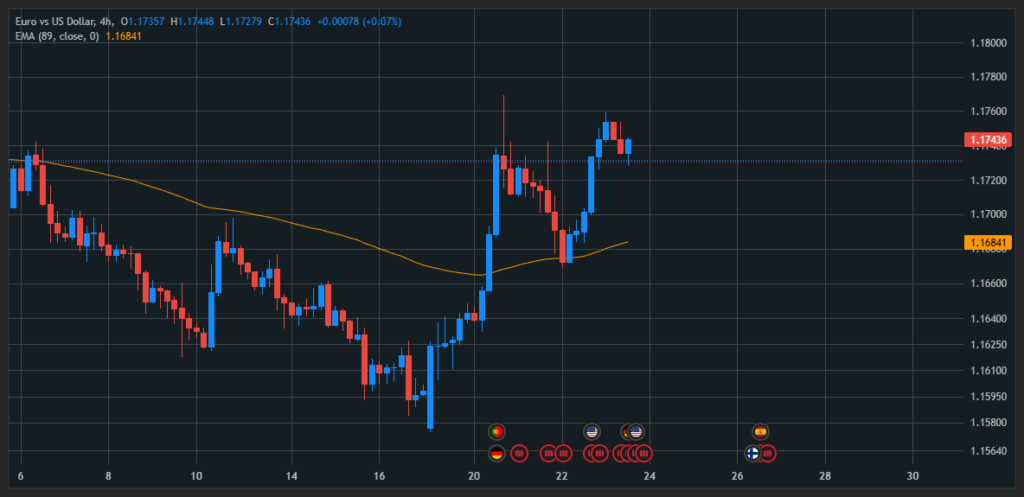
On the H4 chart, EUR/USD is showing a continuation of an uptrend.
- Price is trading above the EMA 89, which confirms bullish structure.
- Previously, price corrected downward but held above EMA 89.
- After that pullback, price rebounded strongly and almost broke the previous high.
As long as price remains above EMA 89 on H4, the bullish bias remains valid.
EUR/USD – H1 Timeframe
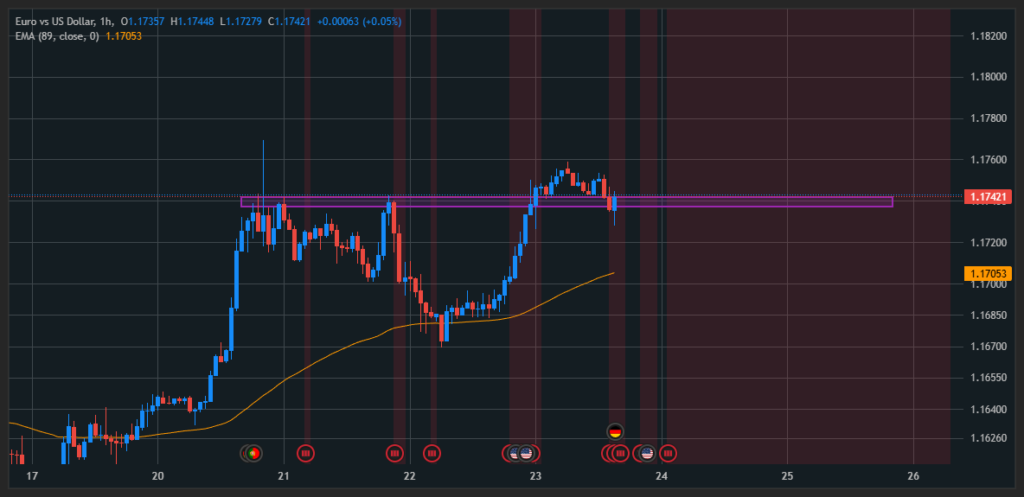
On the H1 chart, price is currently trading near a resistance zone around 1.174xx.
- In previous occasions, price reacted strongly downward at this area.
- At this level, price may range or continue higher — the direction is not predictable.
I do not enter trades based on prediction.
I only enter when my conditions are fully met.
Potential idea:
- A buy setup may be considered near EMA 89 around 1.17053
- Only if price pulls back, shows strong bullish rejection, and closes above EMA 89
Stop loss placement will be determined after price action forms.
EUR/USD – M15 Timeframe
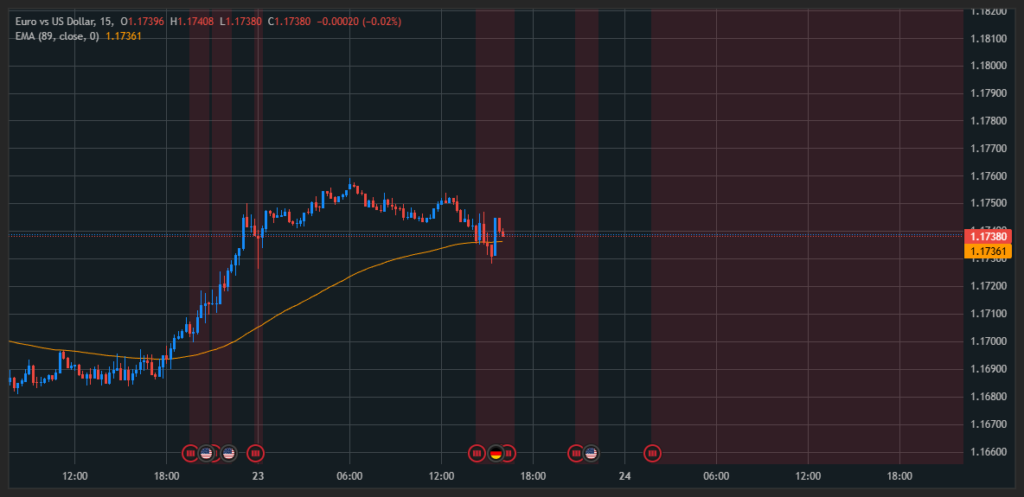
On the M15 chart, price previously:
- Corrected below EMA 89
- Then rebounded strongly back above EMA 89
This creates a short-term bullish continuation opportunity.
Trade Setup (M15):
- Entry: 1.17360 – 1.17400
- Stop Loss: 1.17271 (≈ 13 pips)
- Take Profit: 1.17531 (≈ 13 pips)
This setup follows the higher-timeframe bullish bias from H1 and H4.
GBP/USD Analysis
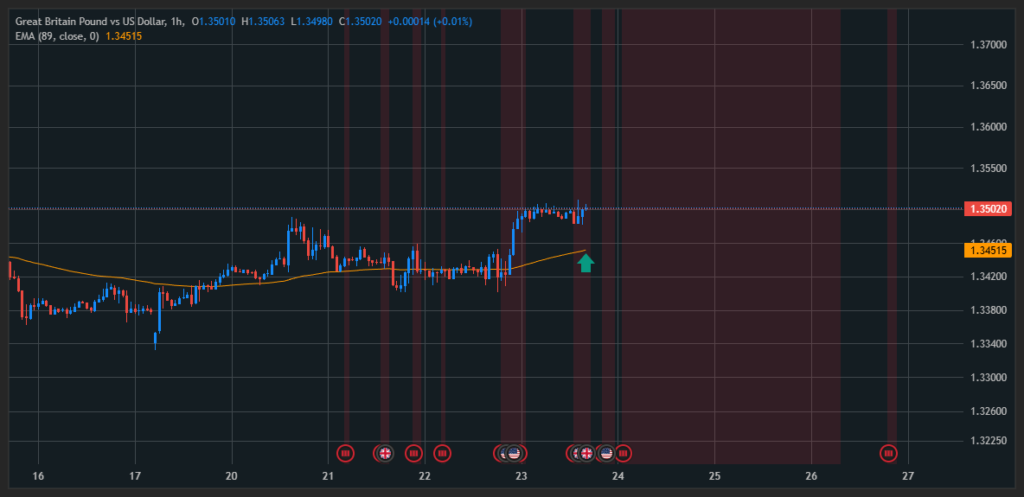
GBP/USD – H4 Timeframe
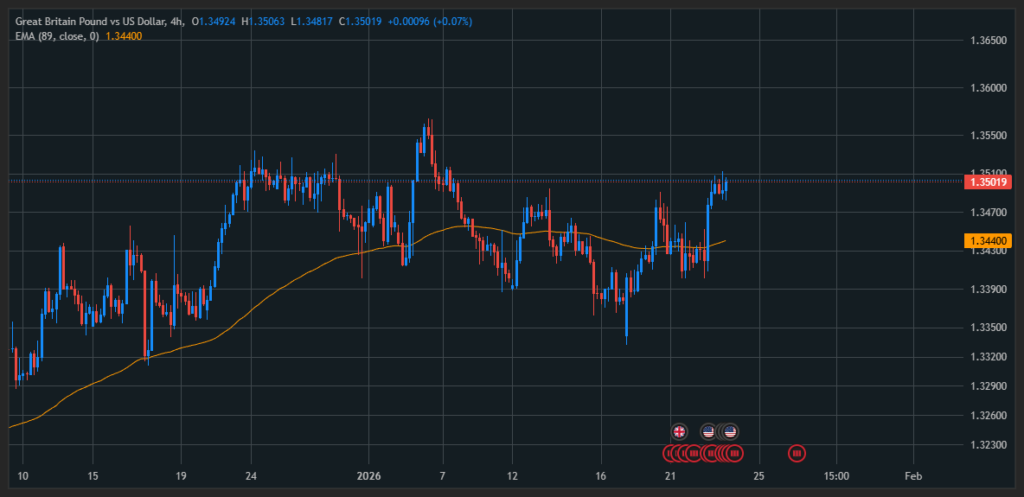
On the H4 chart, GBP/USD continues to show a bullish trend:
- Price is trading above EMA 89
- The market previously corrected back to EMA 89
- Price then broke the previous high, confirming bullish continuation
As long as EMA 89 holds, the uptrend structure remains intact.
GBP/USD – H1 Timeframe
On H1, price is also trading above EMA 89, aligning with the H4 trend.
This confirms:
- Trend alignment between H4 and H1
- A favorable condition to look for buy setups, not sells
The focus remains on waiting for price reaction near EMA 89.
GBP/USD – M15 Timeframe
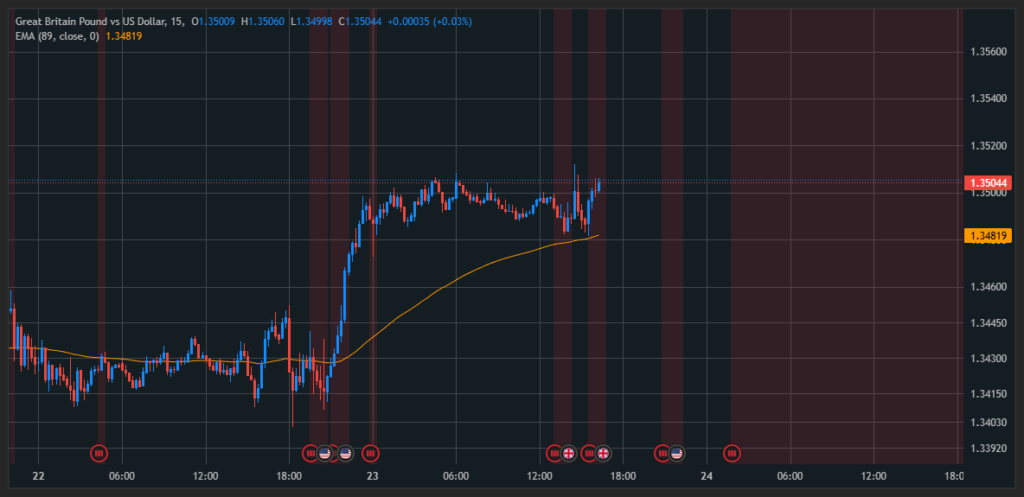
On M15, following the bullish structure of H4 and H1:
- Wait for price to pull back toward EMA 89
- Confirm that price respects EMA 89 as support
Potential Buy Plan:
- Entry: around 1.3481x
- Stop Loss: below the lowest price formed during the pullback to EMA 89
- Take Profit: around 1.35xxx
No trade is taken without confirmation.
USD/JPY Analysis
USD/JPY – H4 Timeframe
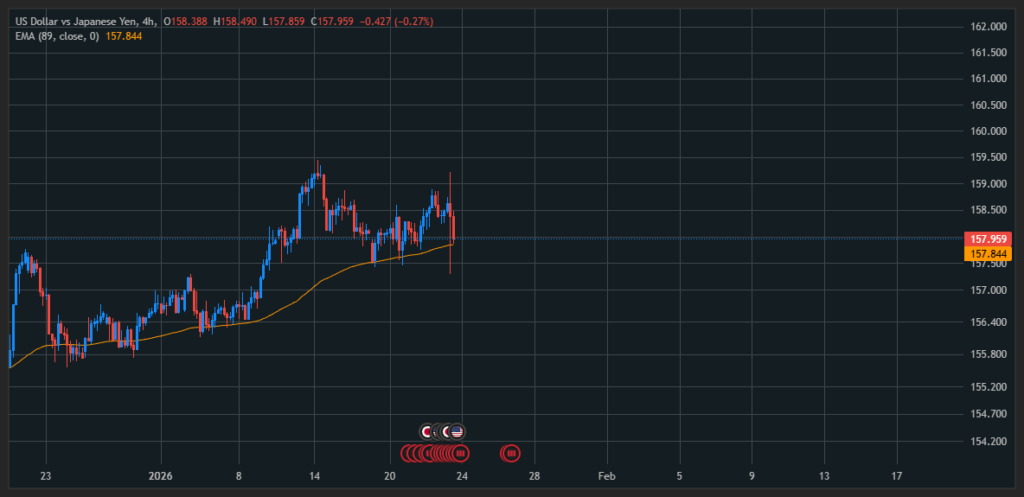
On the H4 chart, USD/JPY previously showed bullish structure:
- Price was trading above EMA 89
- However, price failed to break the previous high
- This led to a pullback toward EMA 89, acting as support
Initial H4 Buy Idea:
- Entry: 157.85 ± 0.1
- Stop Loss: 157.15 (≈ 70.5 pips)
- Take Profit: 158.76 (≈ 90.5 pips)
But before executing, lower timeframes must be checked.
USD/JPY – H1 Timeframe
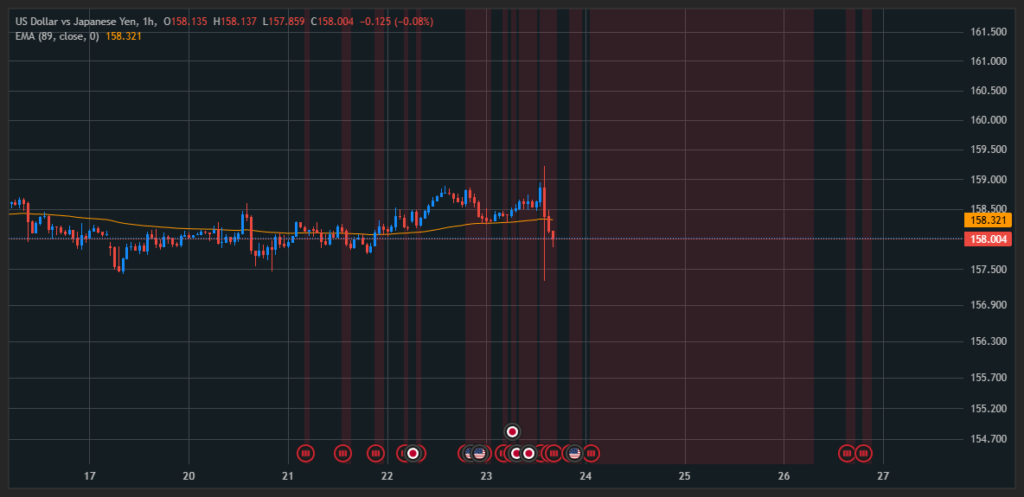
On the H1 chart, price has:
- Broken below EMA 89
- Started trading under EMA 89
This is a negative short-term signal.
Price may remain below EMA 89 for some time before recovering.
Therefore, the H4 buy idea is invalidated for now.
USD/JPY – M15 Timeframe
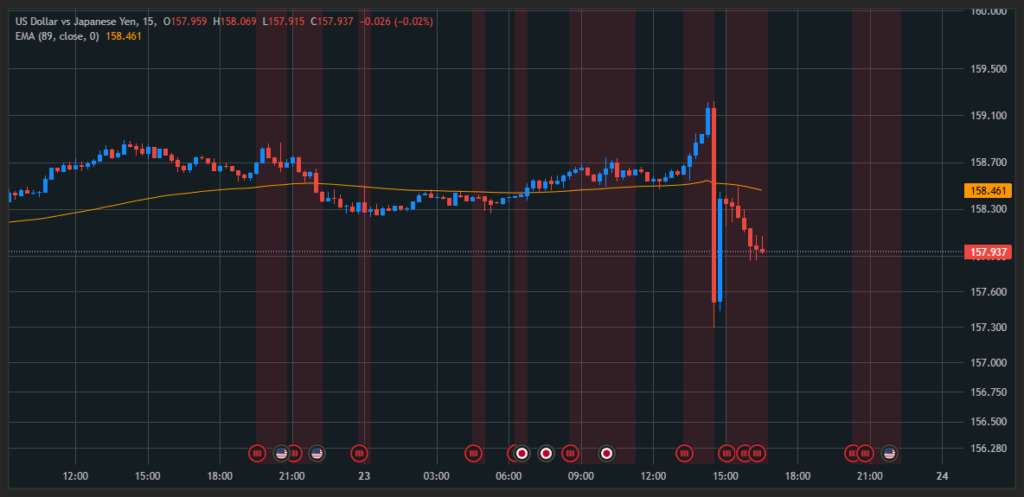
On M15, price structure matches H1:
- Price continues to trade below EMA 89
- This confirms short-term bearish momentum
No buy setup is considered at this stage.
My Trading Rule (Important)
When I plan a Buy or Sell trade, I require confirmation from all three timeframes:
- H4
- H1
- M15
All must align in the same trend direction before I enter a trade.
If one timeframe disagrees, the setup is cancelled.