EUR/USD Analysis
D1 Timeframe – Uptrend Holding Above EMA89
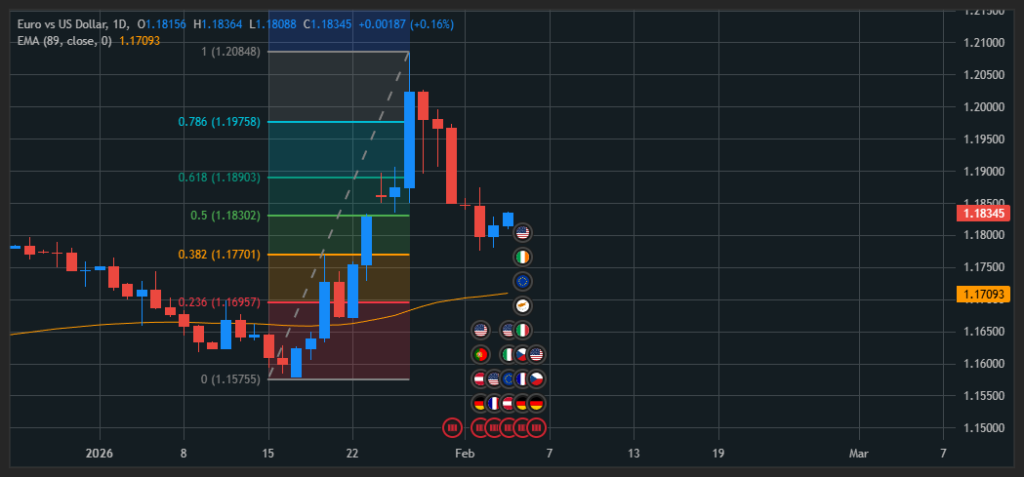
On the daily (D1) chart, EUR/USD previously established a clear bullish trend. After the strong upside move, price entered a corrective phase and retraced toward the Fibonacci 0.382 level, which aligns closely with a key support zone.
At this area, selling pressure has slowed, and price action shows signs of stabilization. Importantly, EUR/USD remains trading above the EMA 89, indicating that the overall bullish structure on the higher timeframe is still intact. As long as price holds above this dynamic support, the primary trend bias remains bullish.
H4 Timeframe – Buy Opportunities Near EMA89
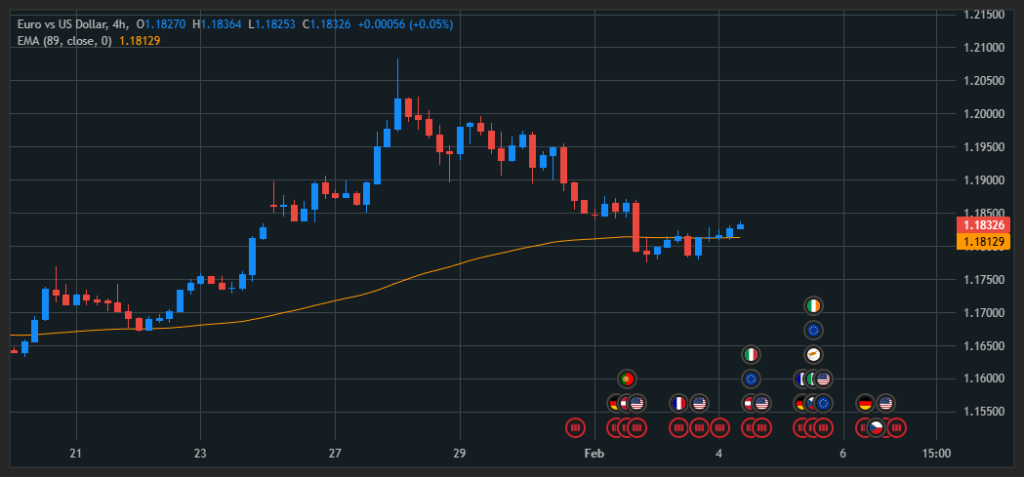
Zooming into the H4 timeframe, we can see that during the corrective move, price temporarily traded below the EMA 89. However, this move was short-lived, and price quickly recovered back above the EMA 89 level.
This behavior suggests that EMA 89 continues to act as a strong dynamic support. Traders may look for Buy opportunities near the EMA 89 zone, aligning entries with the prevailing D1 uptrend.
A logical stop-loss can be placed below the nearest support level, ensuring risk is well controlled.
Every trade involves risk. Always focus first on how much you are willing to lose before considering potential profits.
USD/JPY Analysis
D1 Timeframe – Bullish Shift Above EMA89
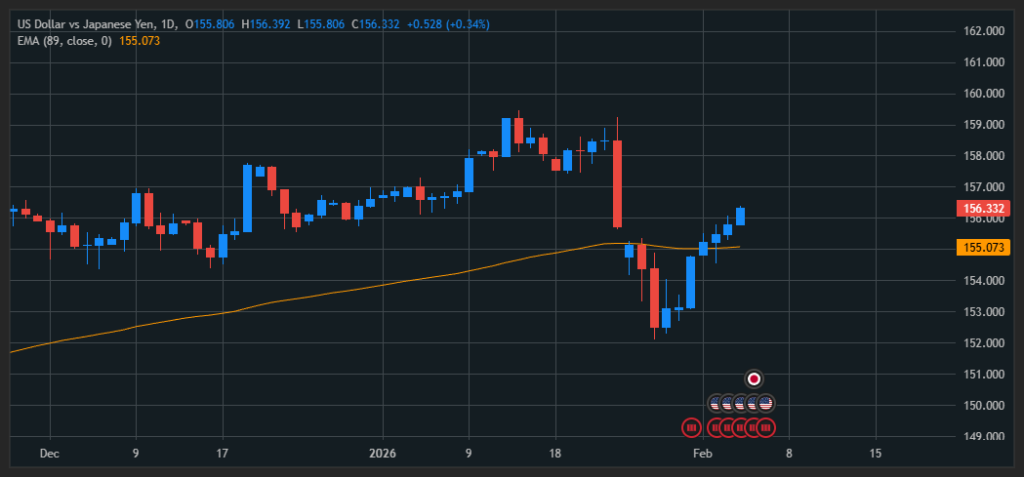
On the daily (D1) chart, USD/JPY was previously in a downtrend, with price trading below the EMA 89. Recently, price has broken back above the EMA 89, signaling a potential shift in market structure.
This breakout above a key dynamic resistance suggests growing bullish momentum and opens the door for a possible continuation to the upside.
H4 Timeframe – Trend-Following Buy Setup
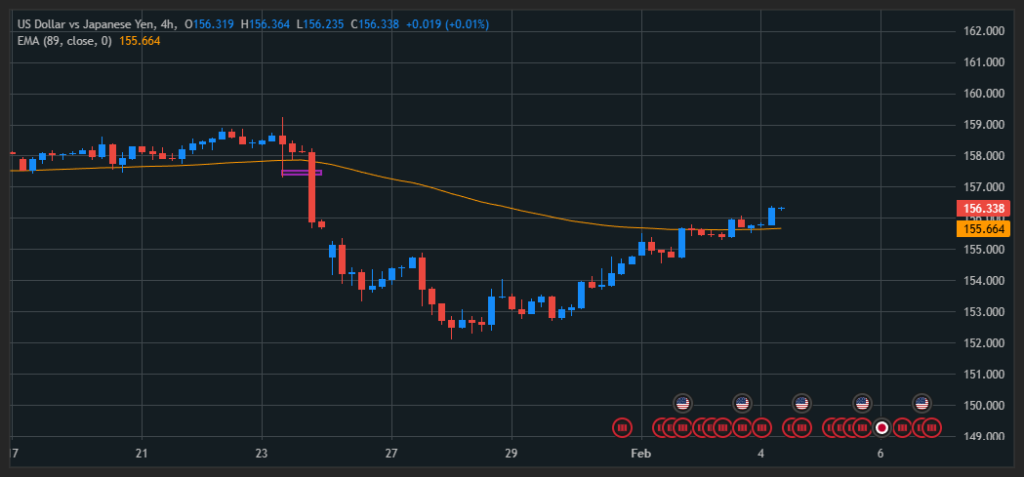
On the H4 timeframe, USD/JPY is now trading firmly above the EMA 89, confirming bullish alignment with the higher D1 timeframe.
Traders may consider trend-following Buy setups when price pulls back toward the EMA 89 support zone.
A protective stop-loss should be placed below the nearest support area to manage downside risk effectively.
CAD/CHF Analysis
D1 Timeframe – Bearish Trend with Corrective Bounce
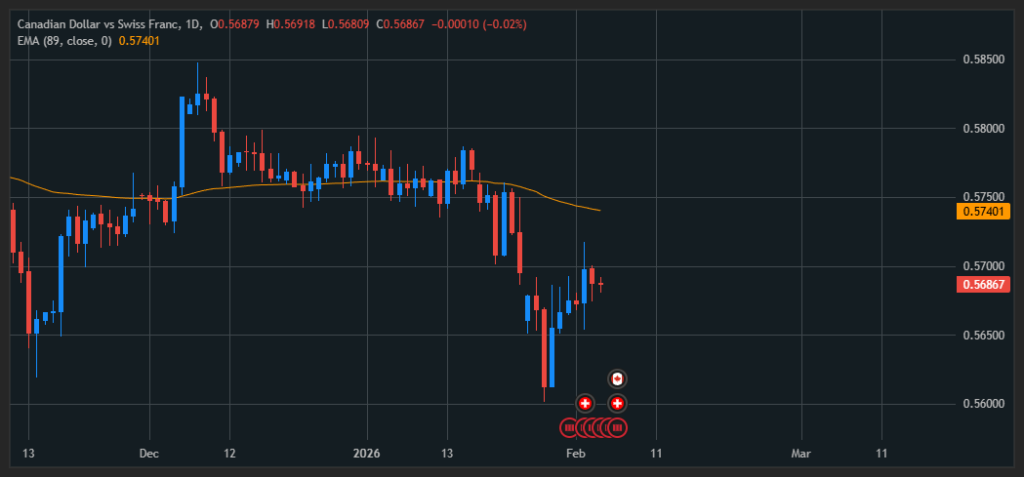
Looking at the daily (D1) chart, CAD/CHF remains in a broader downtrend after decisively breaking below the EMA 89 in the past.
The current price action reflects a corrective rebound following the previous decline, rather than a confirmed trend reversal.
To refine trade opportunities, it is necessary to move down to a lower timeframe.
H4 Timeframe – Sell-on-Retracement Scenario
On the H4 chart, CAD/CHF previously attempted to break above the EMA 89 but failed to hold above this level. Price has since moved back below EMA 89, reinforcing the bearish bias.
This setup favors a Sell-on-retracement strategy, where traders may look for short positions when price revisits the EMA 89 resistance zone.
A reasonable stop-loss can be placed above the nearest resistance level to protect against invalidation of the bearish setup.