
EUR/USD Analysis
H4 Timeframe – Pullback Toward EMA89 Support
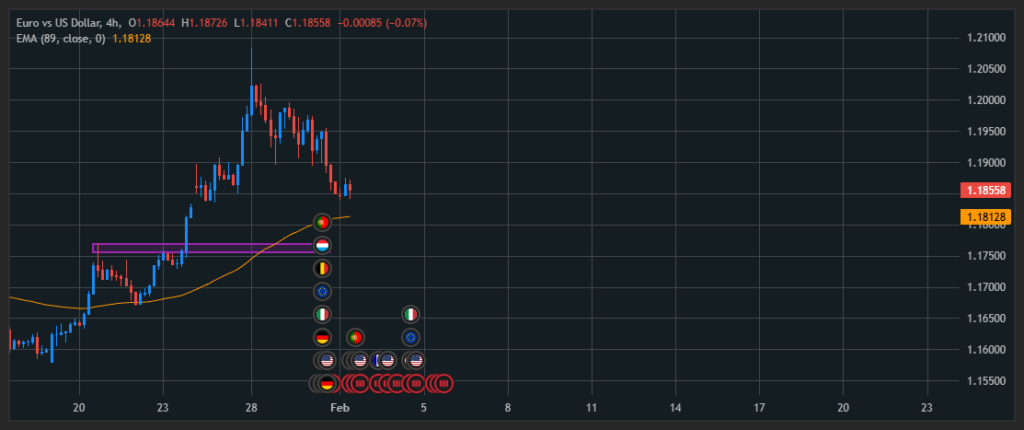
On the H4 chart, EUR/USD remains in a broader bullish structure after the previous strong upside move. Price is currently pulling back and trading very close to the EMA 89 dynamic support zone.
This type of correction is considered healthy within an uptrend. At this stage, instead of entering impulsively, it is more prudent to drop down to lower timeframes to look for confirmation before considering long positions.
H1 Timeframe – Short-Term Bearish Structure
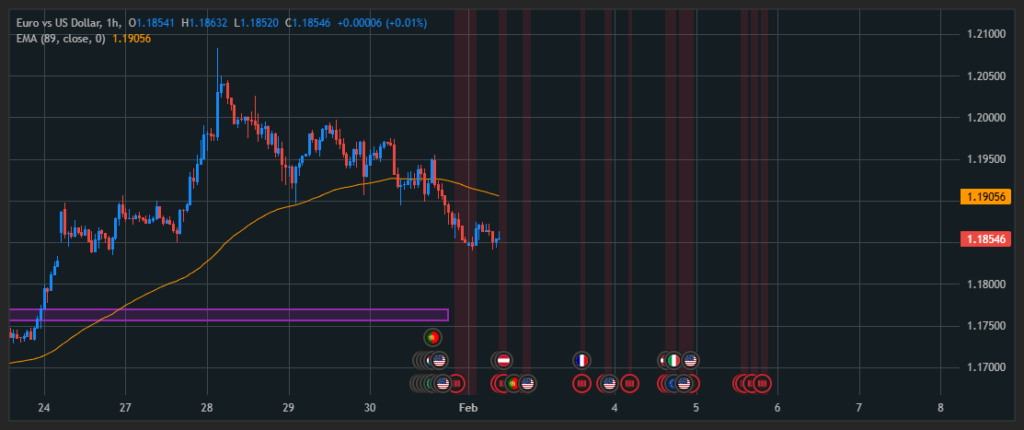
On the H1 timeframe, EUR/USD has temporarily broken below the EMA 89, forming a short-term bearish structure. This move suggests that bearish momentum is still present on the lower timeframe.
Given that the higher timeframe (H4) trend remains bullish, the preferred approach is to wait for price to reclaim and hold above EMA 89 on H1. A confirmed move back above this level would provide a higher-probability Buy opportunity aligned with the dominant H4 trend.
M15 Timeframe – Entry Timing Confirmation

On the M15 chart, EUR/USD is also trading in a short-term bearish phase. For higher confluence, an ideal Buy setup would occur when price on M15 moves back above EMA 89 while H1 also confirms a recovery above EMA 89.
This multi-timeframe alignment increases the probability of entering in the direction of the broader bullish trend.
USD/JPY Analysis
H4 Timeframe – Recovery After Strong Bearish Candle
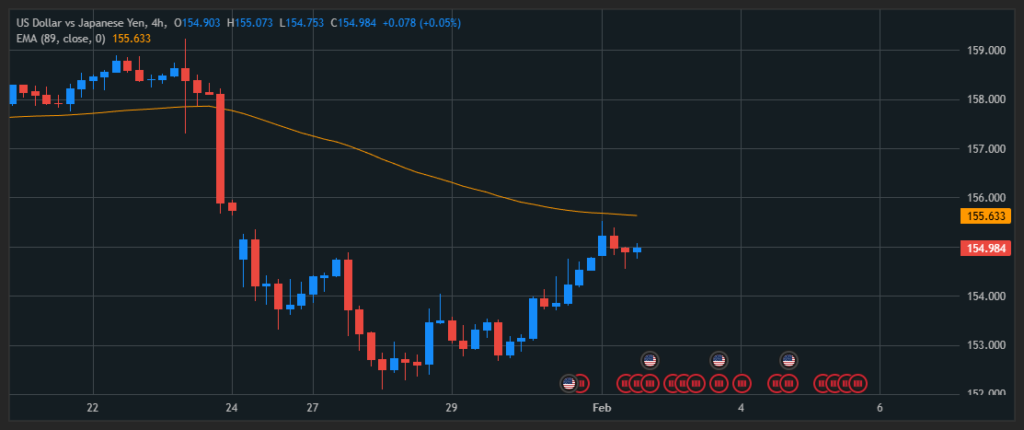
On the H4 chart, USD/JPY previously printed a strong bearish candle that broke decisively below EMA 89, confirming a medium-term bearish bias. Price is now retracing upward and approaching the EMA 89 resistance zone.
At this level, lower timeframes become critical to determine whether the pullback will fail or turn into a broader trend reversal.
H1 Timeframe – Key Decision Zone at EMA89
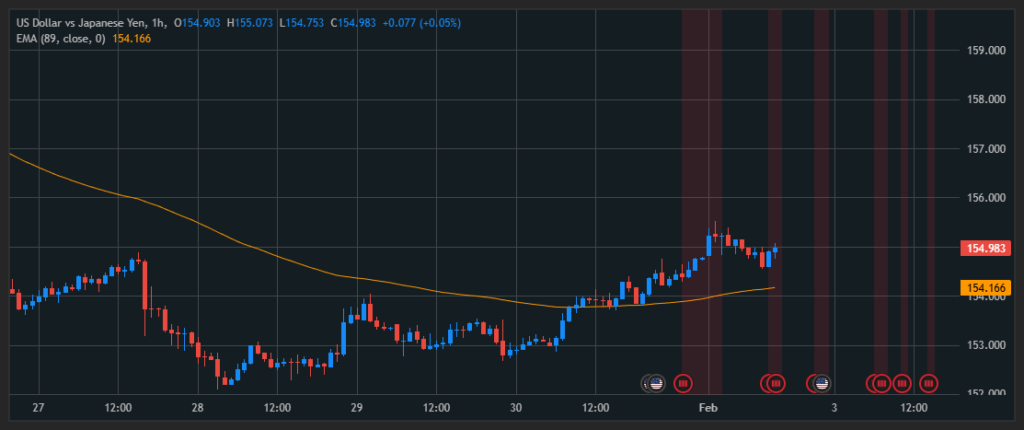
On the H1 timeframe, USD/JPY has temporarily reclaimed EMA 89 and is currently trading above this level. From here, two scenarios are worth monitoring:
Scenario 1 – Bearish Continuation
If price fails to hold above EMA 89 and breaks back below this level, Sell opportunities may appear, especially since the H4 structure remains bearish.
Potential Sell Setup
- Entry: 154.184 (upon rejection below EMA 89 on H1)
- Stop Loss: 155.60 (≈130.4 pips)
- Take Profit: 152.87 (≈141.6 pips)
However, with a risk-to-reward ratio below 1, this setup does not meet strict risk management criteria and may be skipped in favor of higher-quality opportunities.
Scenario 2 – Bullish Breakout (Preferred Scenario)
If price breaks strongly above 155.60 and holds above EMA 89, this would signal bullish strength and open the door for Buy opportunities.

M15 Timeframe – Tactical Entry Zone
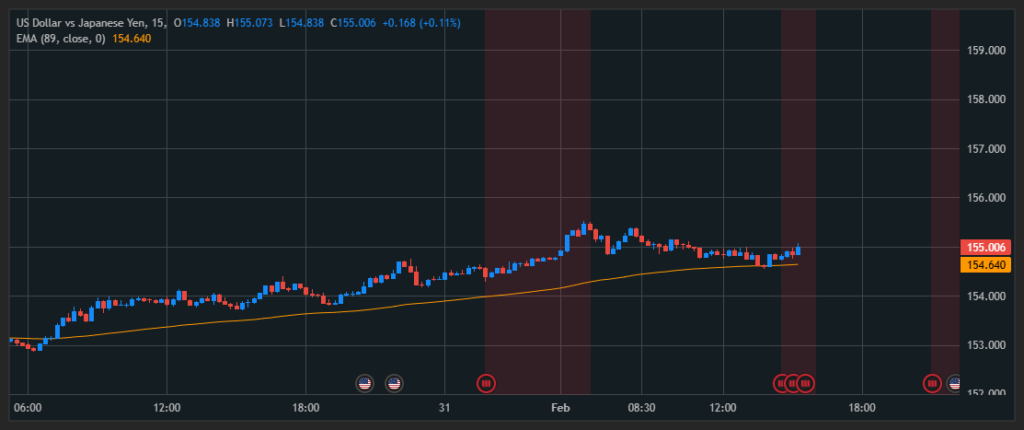
On the M15 timeframe, USD/JPY is trading in alignment with the H1 structure above EMA 89. Pullbacks toward EMA 89 on this timeframe may offer tactical entry opportunities.
A reasonable approach is to place stop loss below the nearest support zone and target the most recent swing high as take profit, maintaining alignment with higher timeframes.
EUR/JPY Analysis
H4 Timeframe – Potential Trend Shift
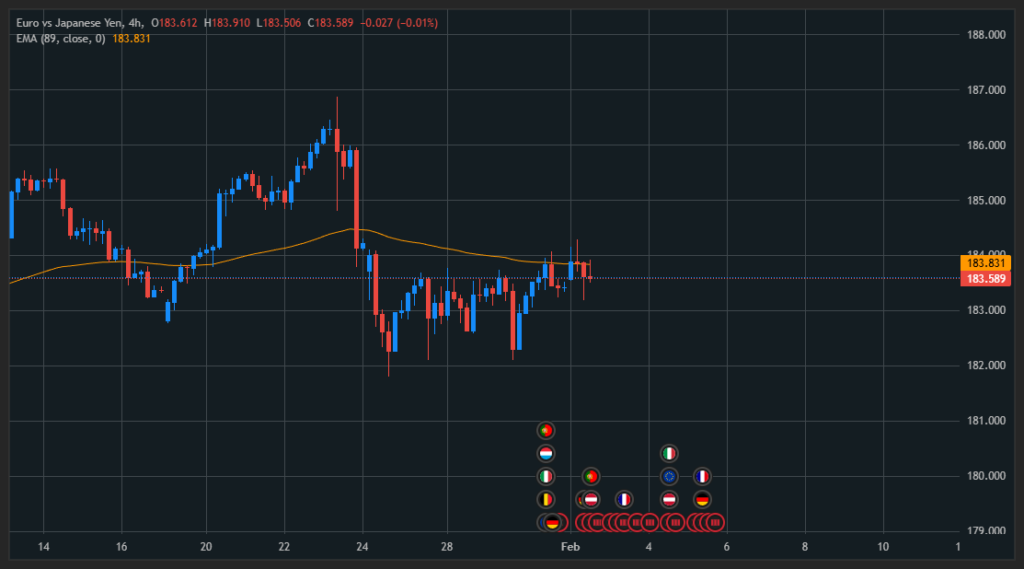
On the H4 chart, EUR/JPY is approaching the EMA 89 resistance level. A confirmed breakout above EMA 89 would indicate a potential transition from a bearish structure to a bullish trend.
Early positioning after a confirmed breakout could offer attractive upside potential if bullish momentum develops.
H1 Timeframe – Lack of Confirmation
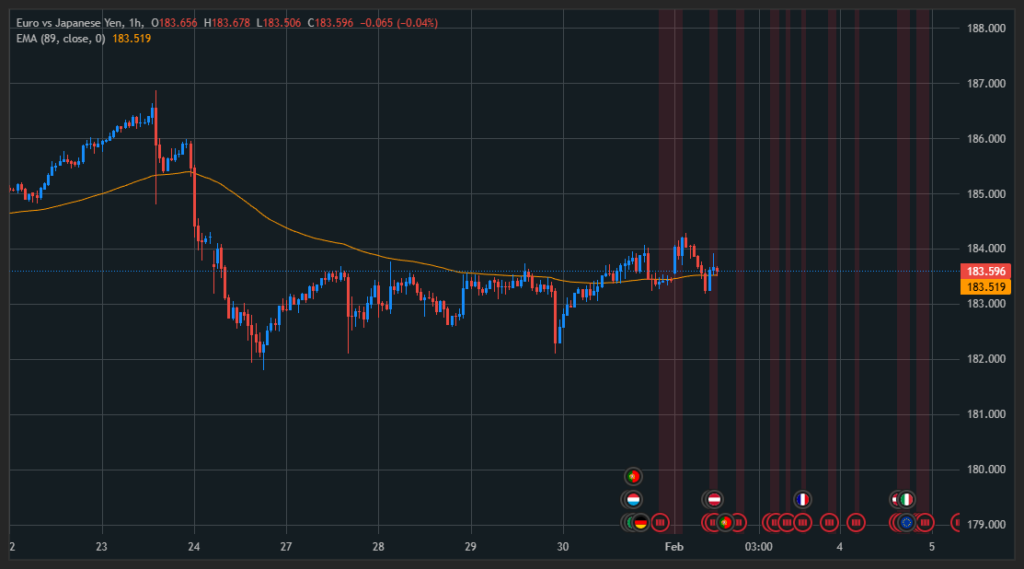
On the H1 timeframe, EUR/JPY has already attempted to break above EMA 89 twice but failed to sustain trading above this level. Price has repeatedly fallen back below EMA 89, signaling weak bullish follow-through.
At this stage, the preferred strategy is to remain patient and wait for a confirmed bullish breakout on the higher H4 timeframe before looking for long setups.