
EUR/USD Analysis
EUR/USD – H4 Timeframe
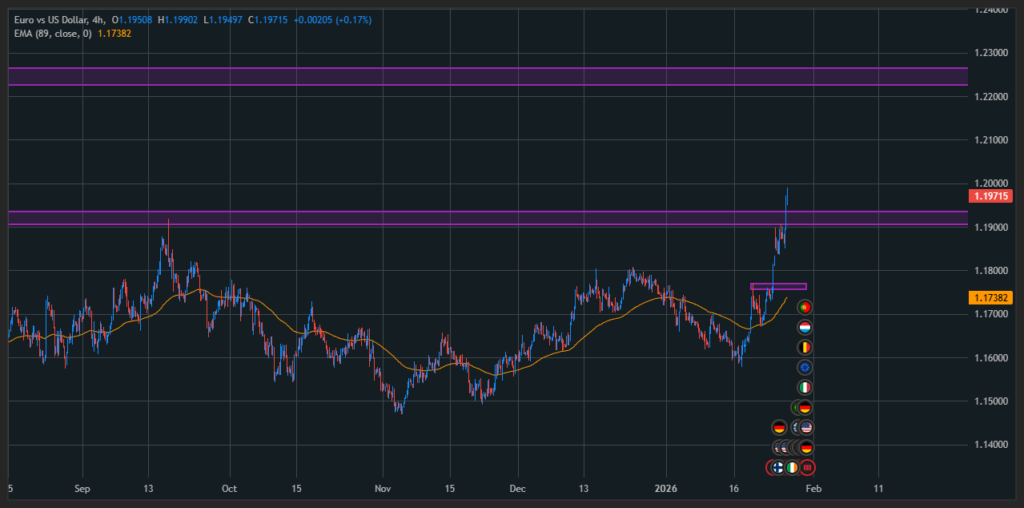
On the H4 timeframe, EUR/USD has successfully broken above the previous upper wick high formed on September 17, 2025. Price is now trading cleanly above this level, confirming that bullish momentum remains intact.

As long as the pair continues to hold above this former resistance, the overall market structure stays bullish. With the higher-timeframe trend clearly pointing upward, the focus shifts to lower timeframes to look for buying opportunities in line with the trend.
EUR/USD – H1 Timeframe
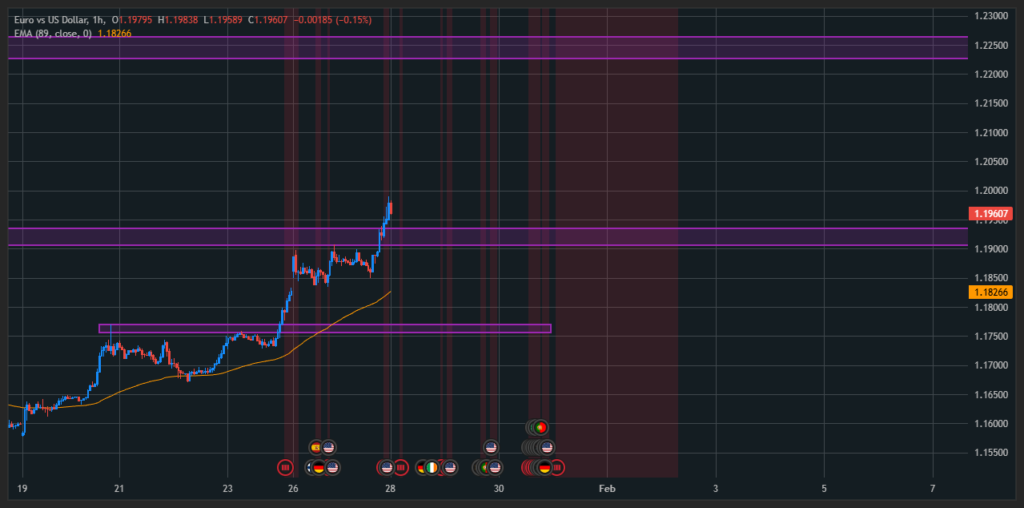
On the H1 chart, the strong bullish move has pushed price well above the EMA89, creating distance from the nearest dynamic support.
Rather than chasing price at extended levels, the preferred scenario is to wait for a healthy pullback toward the EMA89, currently located around the 1.173xx area.
If price revisits this zone and shows a constructive reaction, it could offer a higher-probability continuation setup within the prevailing uptrend.
EUR/USD – M15 Timeframe
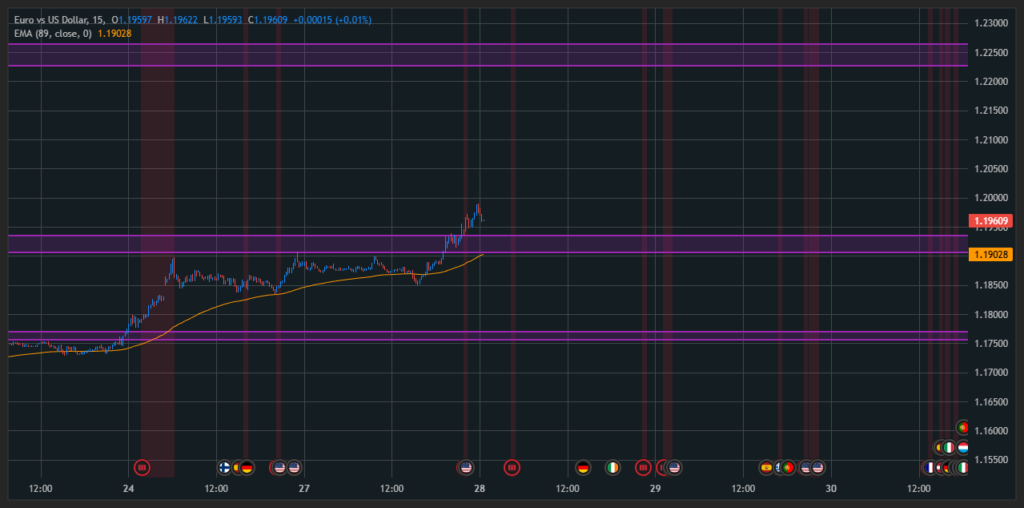
Dropping further to the M15 timeframe allows for more precise entry planning.
On this smaller timeframe, a potential buy zone appears near the EMA89, with an ideal price area around 1.19xxx.
However, no trade is considered until price actually retraces into this support area and price action confirms buyer interest. Patience remains key.
AUD/CHF Analysis
AUD/CHF – H4 Timeframe
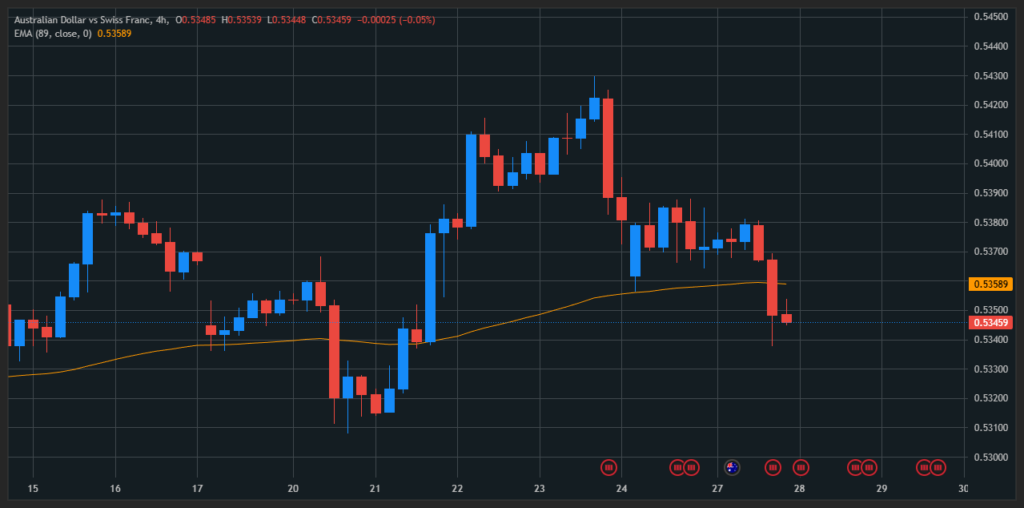
On the H4 chart, AUD/CHF has decisively broken below the EMA89, which previously acted as dynamic support. This breakdown signals a shift in market structure, confirming the pair has entered a bearish trend.
With price now trading below EMA89, the bias favors sell opportunities, and attention moves to lower timeframes for better positioning.
AUD/CHF – H1 Timeframe
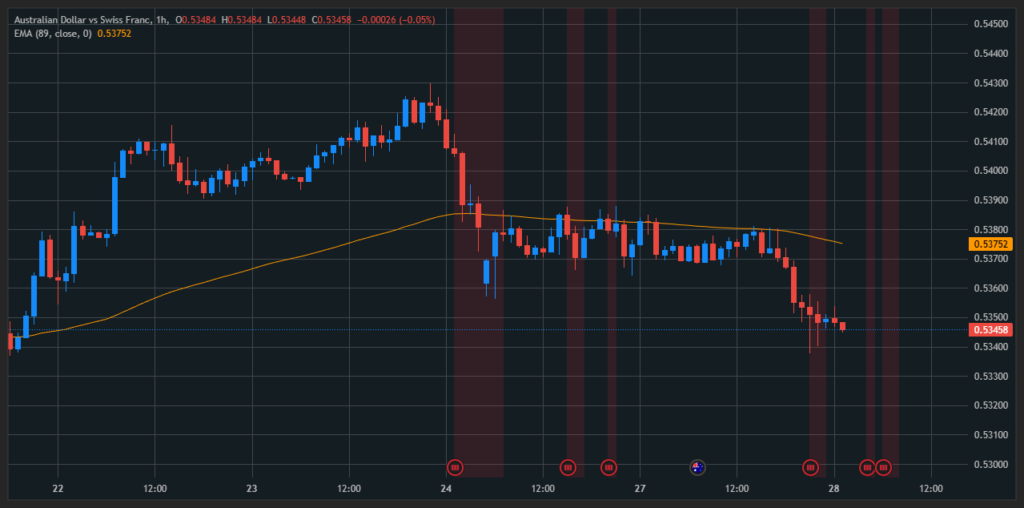
On the H1 timeframe, price is currently trading far below the EMA89, which now acts as dynamic resistance around 0.537xx.
If price retraces back toward this resistance zone, monitoring the reaction becomes crucial. A bearish response at EMA89 would provide a favorable area to look for sell setups in line with the higher-timeframe downtrend.
AUD/CHF – M15 Timeframe
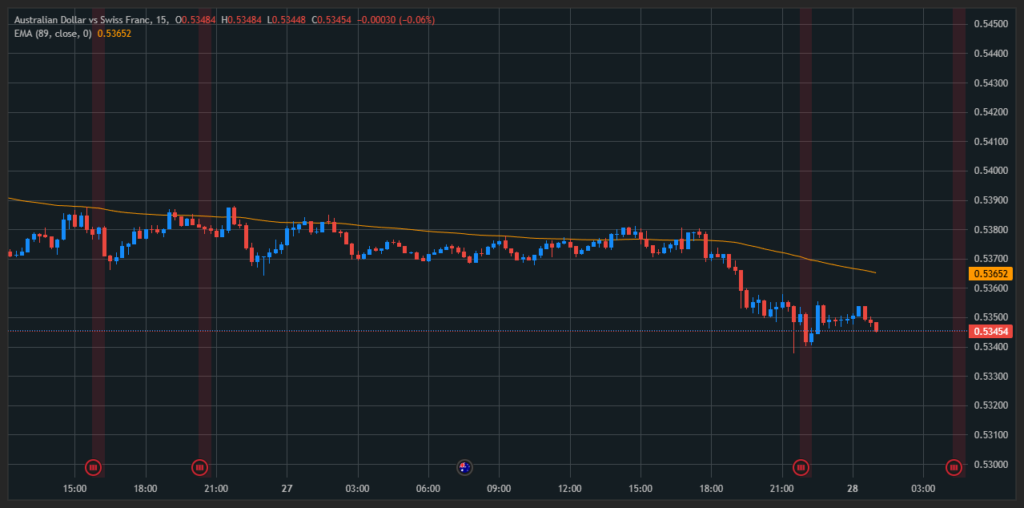
On the M15 chart, a more refined sell zone can be identified near 0.53650, slightly below the H1 resistance level.
The plan remains straightforward: wait for price to return to this area and evaluate price behavior. If sellers step in, this zone may offer a lower-risk sell entry aligned with the dominant trend.
EUR/AUD Analysis
EUR/AUD – H4 Timeframe
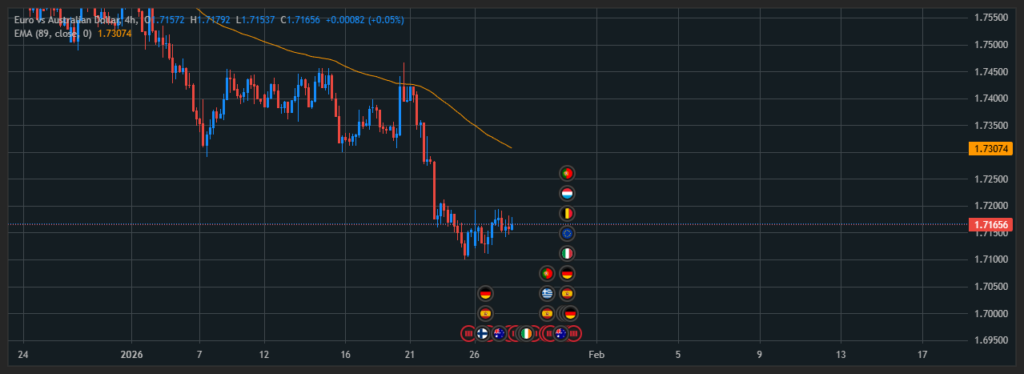
On the H4 timeframe, EUR/AUD is clearly trading below the EMA89, confirming that the pair remains in a downtrend.
The loss of EMA89 support reinforces bearish market conditions, making sell setups the primary focus across lower timeframes.
EUR/AUD – H1 Timeframe
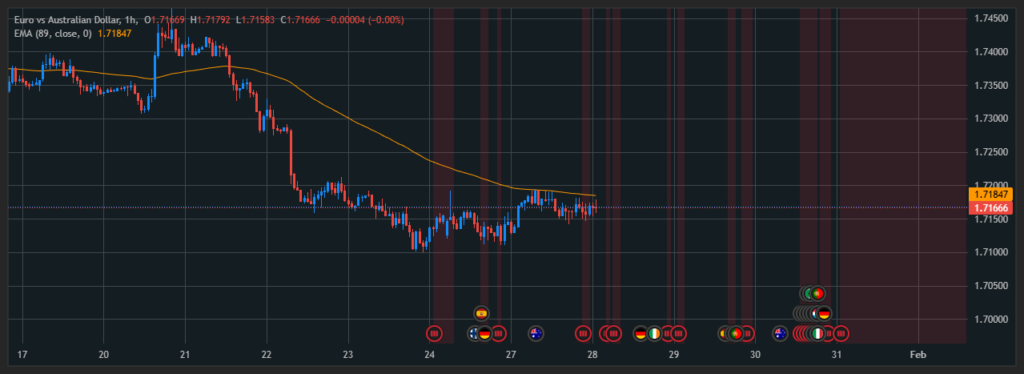
On the H1 chart, price is currently trading near the EMA89, which now acts as resistance.
This area represents a logical zone to look for short positions, provided price shows rejection or weakening bullish momentum near the EMA89 level.
Trade Setup – EUR/AUD (Sell)
- Sell Entry: 1.7185 – 1.7170
- Stop Loss: 1.71965 (approximately 21 pips)
- Take Profit: 1.713xx (approximately 50 pips)
This setup aligns with the higher-timeframe downtrend, with risk-to-reward favoring continuation to the downside.