
Market Overview
Today is Sunday, when the Forex market is closed. In this analysis, I’ll provide a technical outlook for the Forex market at the start of the new trading week on Monday, January 26.
This analysis focuses on price behavior, trend continuation, and key reaction zones across multiple timeframes, helping traders prepare scenarios before the market opens.
EUR/USD Analysis
EUR/USD – H4 Timeframe
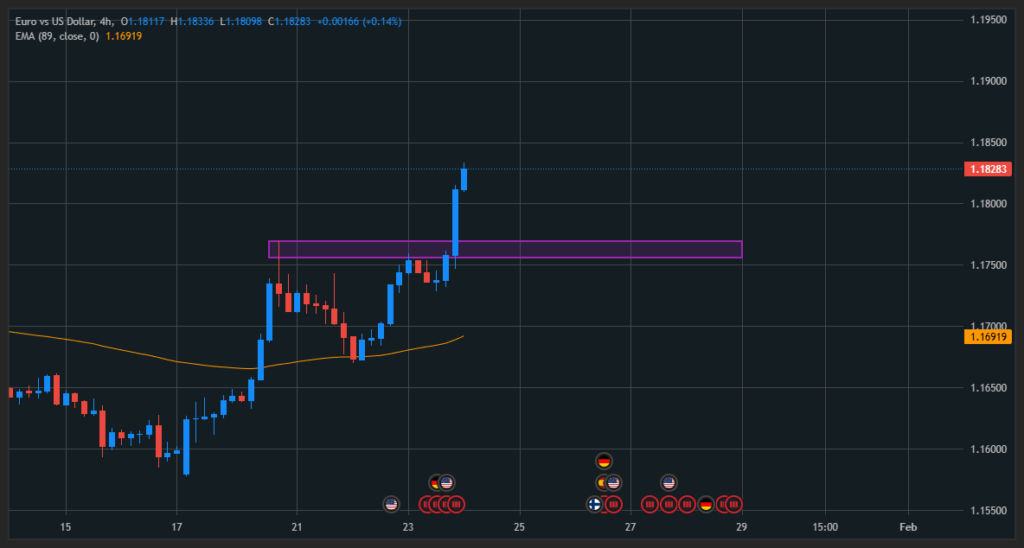
On the H4 chart, EUR/USD shows strong bullish dominance, with three consecutive bullish candles breaking decisively above the most recent swing high.
This price action confirms a continuation of the existing uptrend.
At this stage, price has moved far away from the EMA support zone, meaning it is not an ideal location to chase buy entries immediately. Instead, the focus remains on waiting for pullbacks toward healthier support areas.
In a confirmed uptrend, selling against momentum is not considered favorable, as it goes against the prevailing market structure.
EUR/USD – H1 Timeframe
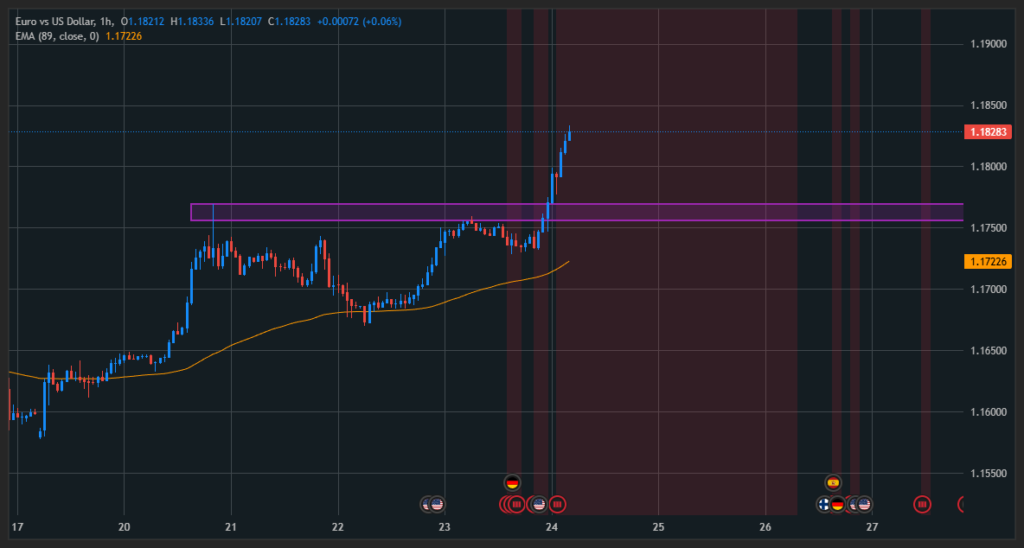
Zooming into the H1 timeframe, the bullish structure remains intact. Price continues to trend higher, following the strength seen on H4.
However, similar to the higher timeframe, price has already moved beyond optimal buy locations.
A potential area of interest appears near the EMA89 around the 1.172xx zone, where a controlled pullback could offer better insight into market intent.
At this level, price reaction and structure confirmation become key before considering any directional decision.
EUR/USD – M15 Timeframe
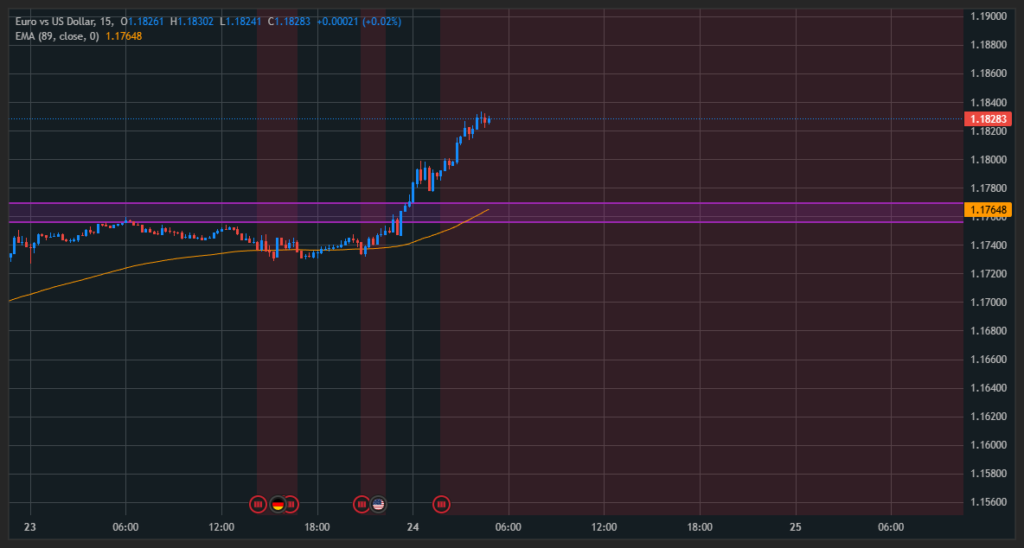
On the M15 timeframe, traders can monitor a higher intraday support zone around 1.176xx.
For this setup to remain valid:
- The level must hold firmly
- Price should not break deeply below this area
Patience is essential here. Allowing price to reveal its behavior at support helps avoid emotional or premature decisions.
GBP/USD Analysis
GBP/USD – H4 Timeframe
During the final trading sessions of last week, GBP/USD decisively broke above two major resistance levels at 1.348xx and 1.356xx.
Price is now progressing toward the 1.367xx area, maintaining a clear bullish trend structure.
At the moment, price remains significantly above the EMA89, indicating strong momentum but also reduced risk-reward for immediate entries.
The preferred approach in such conditions is to wait for a corrective move back toward EMA-based support, then evaluate price behavior.
In an established uptrend, the focus remains on buying pullbacks, not selling against momentum.
GBP/USD – H1 Timeframe
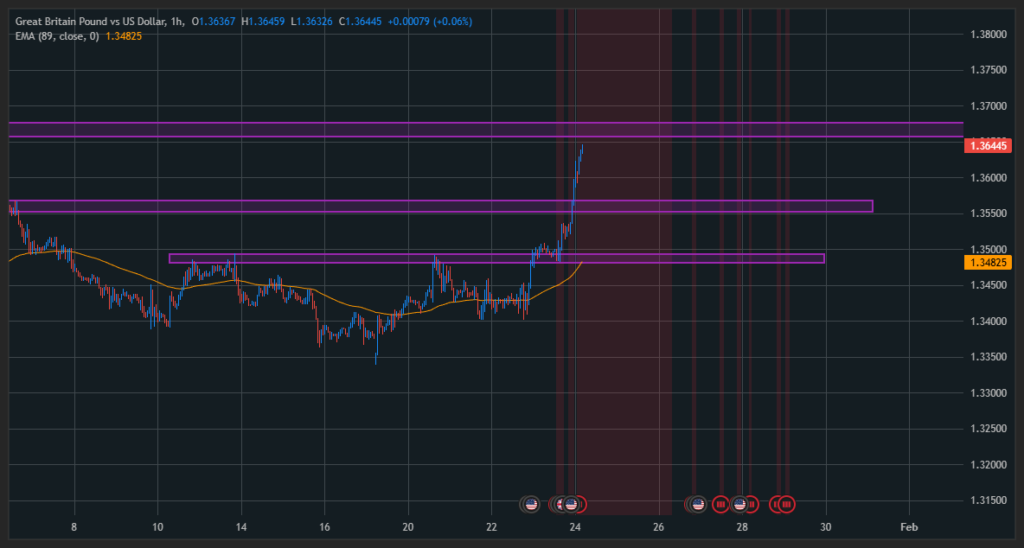
On the H1 chart, the bullish trend from H4 is clearly reflected. Price continues to make higher highs and higher lows.
However, price has already extended far from favorable entry zones.
A potential support reaction zone sits near 1.348xx, which could become relevant if price pulls back and holds above this level.
Again, confirmation through price action is essential before any directional bias is reinforced.
GBP/USD – M15 Timeframe
On the shorter-term M15 timeframe, attention can be given to the 1.355xx area.
This zone may provide intraday context if price retraces. The key remains observing market reaction, not predicting outcomes.
Trading Mindset Reminder
There is no holy grail in trading.
Only discipline, consistency, and strict execution of a well-defined trading plan.
USD/JPY Analysis
USD/JPY – H4 Timeframe
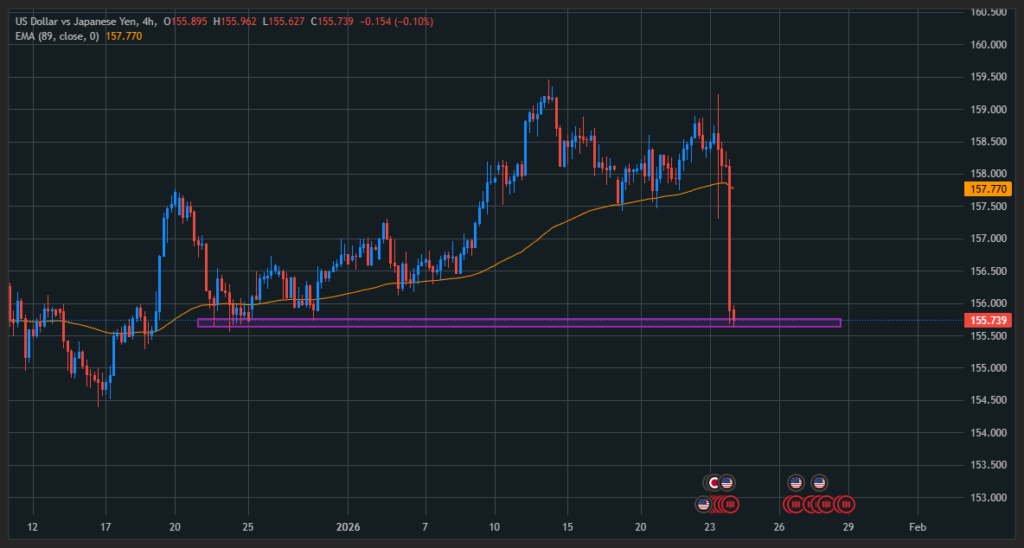
On the H4 chart, USD/JPY printed a strong bearish candle that broke decisively below the EMA89, signaling a shift into a bearish trend.
With market structure now pointing lower, the primary focus shifts toward sell opportunities on pullbacks.
Buying in this context is considered counter-trend and high risk.
USD/JPY – H1 Timeframe
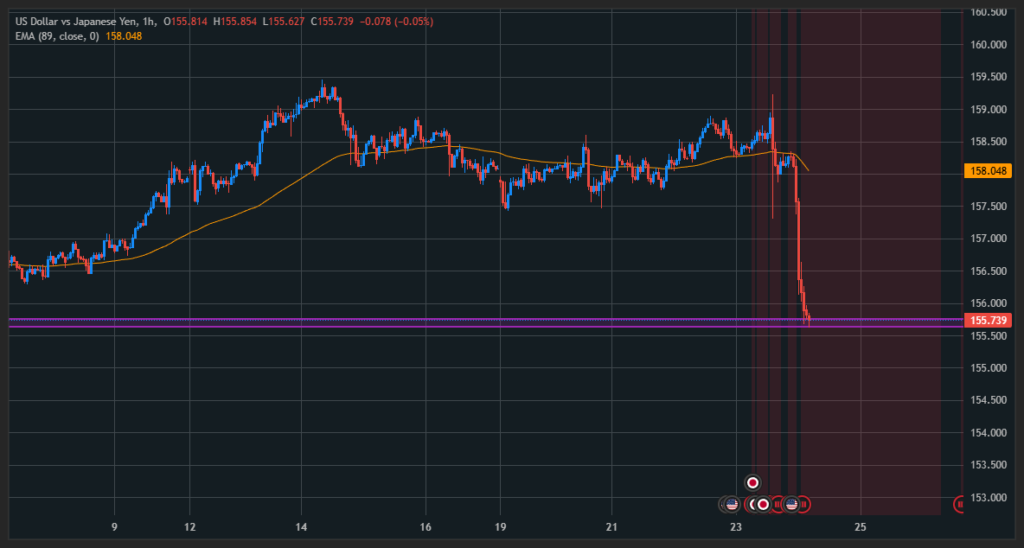
Dropping to the H1 timeframe, bearish momentum remains dominant. Price continues to print consecutive bearish candles, with no meaningful bullish correction so far.
A potential pullback zone appears near the EMA89 around the 158.00 area.
If price retraces into this region, it becomes a key area to observe bearish continuation signals.
USD/JPY – M15 Timeframe
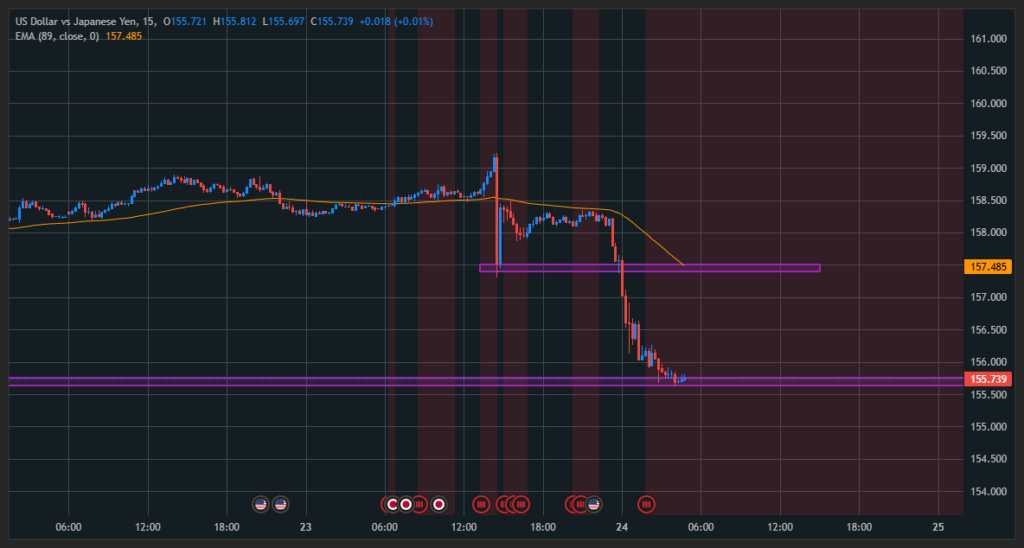
On the M15 chart, a short-term sell reaction may be observed near 157.485.
However, if this level fails to hold, traders should avoid forcing entries and instead wait for price to retrace toward higher-timeframe resistance zones, such as those identified on H1.